File:cholesterol-band.png
Figure file · Standard errors, and models for counts
Size of this preview: 818 × 520 pixels. Select it to open the high-resolution file.
Summary
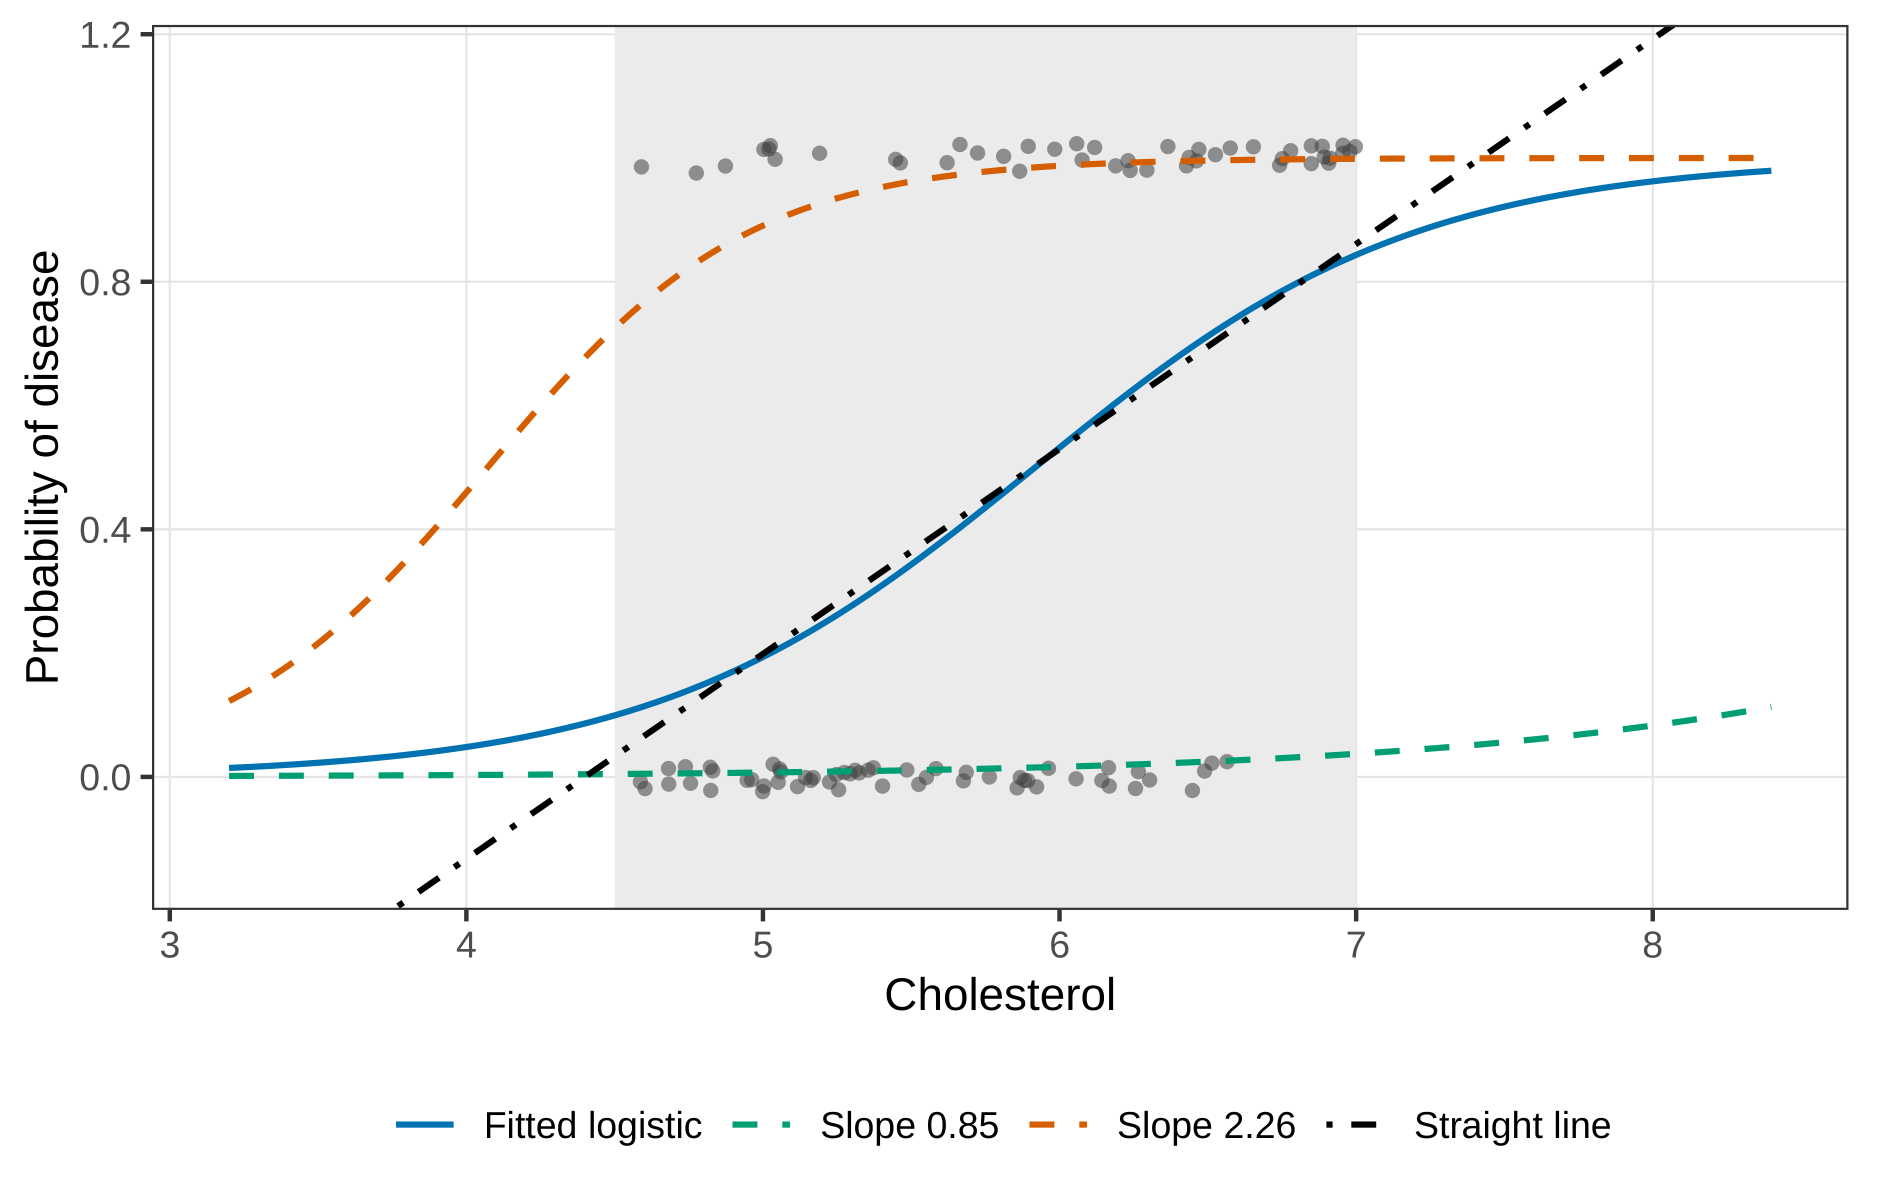
Description. Probability of disease against cholesterol. Points are jittered off 0 and 1. The shaded window runs from 4.5 to 7. The solid curve is the fitted logistic. The dashed curves keep that intercept and use the endpoints 0.85 and 2.26 of the slope interval. The straight line is least squares, extended until it leaves (0,1).
Appears in. Standard errors, and models for counts
Made by. A figure from the course chapter.
Download
- PNG, high resolution (1888 × 1200 pixels, 124 KB)
- PNG, as shown on the wiki (818 × 520 pixels, 49 KB)
- PDF, vector, prints at any size (19 KB)
File usage
This page shows the file: