Forecasting
Part of Time series · 2 questions on this topic · What links here
Forecasting
| Part | Time series |
| Chapter | 2 of 2 in this part |
| Previous | Dependence along a series |
| Questions | 2 |
| Figures | 5 |
The theory stopped at the Wold decomposition. This chapter is about using it. Rob Hyndman’s forecast package fits a model and returns a point forecast and a prediction interval. Once the package is installed, the function is left to choose the orders. The point is that the automatic choice does what the autocorrelation plots would have suggested by hand.
Accidental deaths
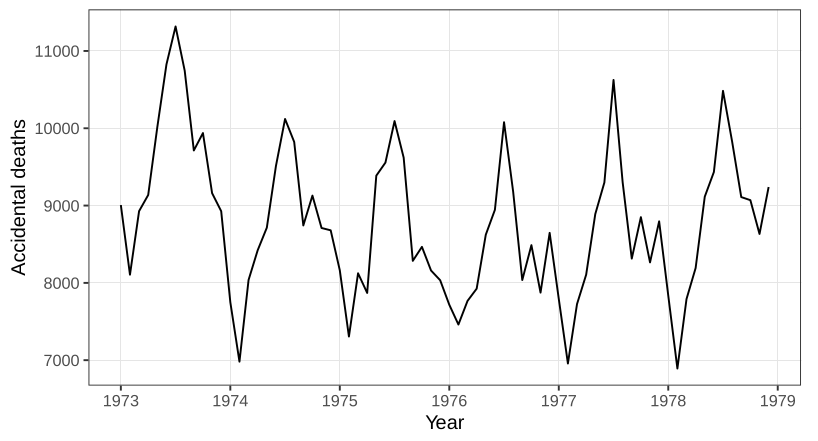
USAccDeaths is a monthly count of accidental deaths in the United States, six years, 72 months, ending in December 1978.
Plotting a series that R already knows is a time series puts time on the horizontal axis. Figure 1 is not white noise. Deaths are higher in the middle of the year, the northern summer, and lower in winter. A twelve-month cycle is the obvious feature. The overall level is not a straight trend. It sags and then recovers, the sort of slow movement produced when a temporary legal or behavioural change pulls a series down and then lets it drift back.
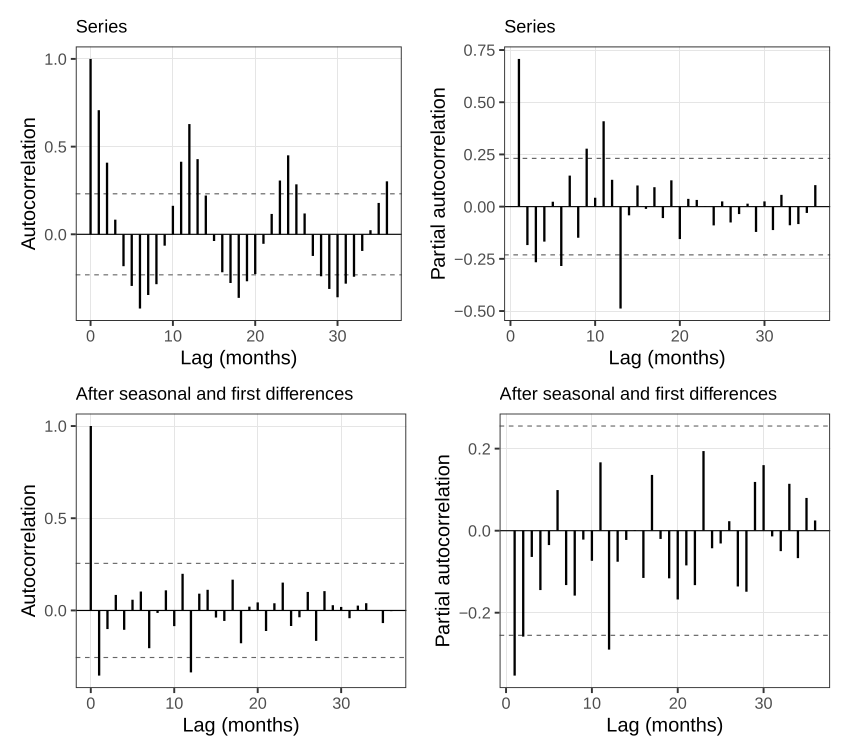
The autocorrelation and the partial autocorrelation both keep oscillating. An MA process would cut the autocorrelation off after a finite lag. An AR process would cut the partial autocorrelation off. Neither plot dies. That is the seasonality, still in the correlations.
Differencing at lag 12, \nabla_{12} X_t=X_t-X_{t-12}, removes a twelve-month cycle and, as a side effect, a linear trend. The differenced series still slopes. A linear trend left after a seasonal difference means the original series had a quadratic trend. One further difference at lag 1 takes that slope out. What remains is closer to a constant mean and a constant scatter. The autocorrelation of that twice-differenced series still has a spike at the first lag, and a spike near one year. Those are the MA terms.
auto.arima, with the seasonal option left on, finds this without being told that the data are monthly.
need <- function(pkg) {
  if (!requireNamespace(pkg, quietly = TRUE)) {
    install.packages(pkg, repos = "https://cloud.r-project.org")
  }
  suppressPackageStartupMessages(library(pkg, character.only = TRUE))
}
need("forecast")
fit <- auto.arima(USAccDeaths, seasonal = TRUE)
fit
fc <- forecast(fit, h = 12)
fc$mean[1]
sum(fc$mean)
The selected model differences once at lag 12, keeps a seasonal MA(1) on that yearly lag, differences once more at lag 1, and keeps an ordinary MA(1). There is no AR term. Both MA coefficients are negative. They are read as behaviour rather than as algebra. If last month was worse than the month before, this month is more careful, and the coefficient on that surprise is negative. If last year was worse than the year before, this year is more careful, and the seasonal coefficient is negative too. A good year, by the same arithmetic, is followed by a slack one. The AIC is what the function used to choose the orders. BIC is available and was not the default.
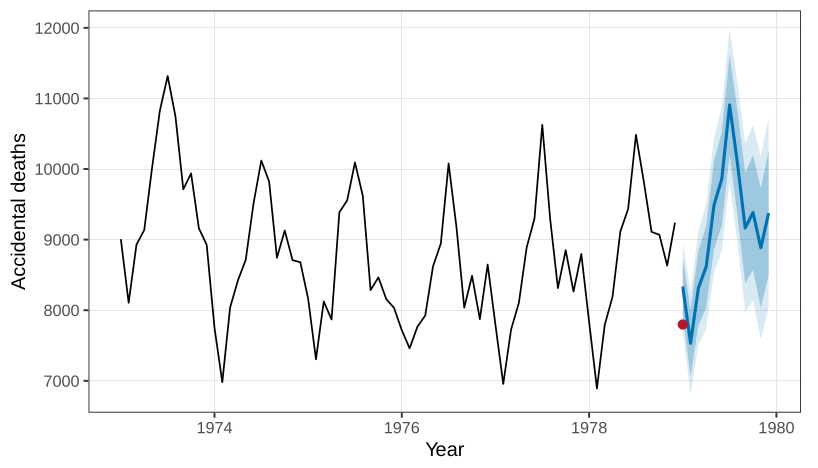
The series stops in December 1978. One step ahead, January 1979, the point forecast is 8336 deaths, with an 80% interval and a wider 95% interval. Figure 3 is that forecast. The same step, read more roughly, is about 8400. The two figures are the same forecast read at two moments. The reported January total is 7798, inside the 95% band and low relative to the point forecast. Twelve steps ahead, the forecasts trace one more seasonal shape, and the sum of those twelve monthly forecasts was about 109{,}000. A reported annual total for 1979 is near 105{,}000. Further out, past a few years, the local MA terms die and the forecast repeats the seasonal shape on top of the quadratic trend. A long-range forecast from this model is the mean structure. A short-range forecast still feels the last surprise.
The function was not told the period. It found 12. That is the part worth trusting the automation for: it matched the differencing the seasonal plot would have suggested.
A hundred minutes of traffic
WWWusage counts hits on a server, one number per minute for 100 minutes. There is no season in a series that short.
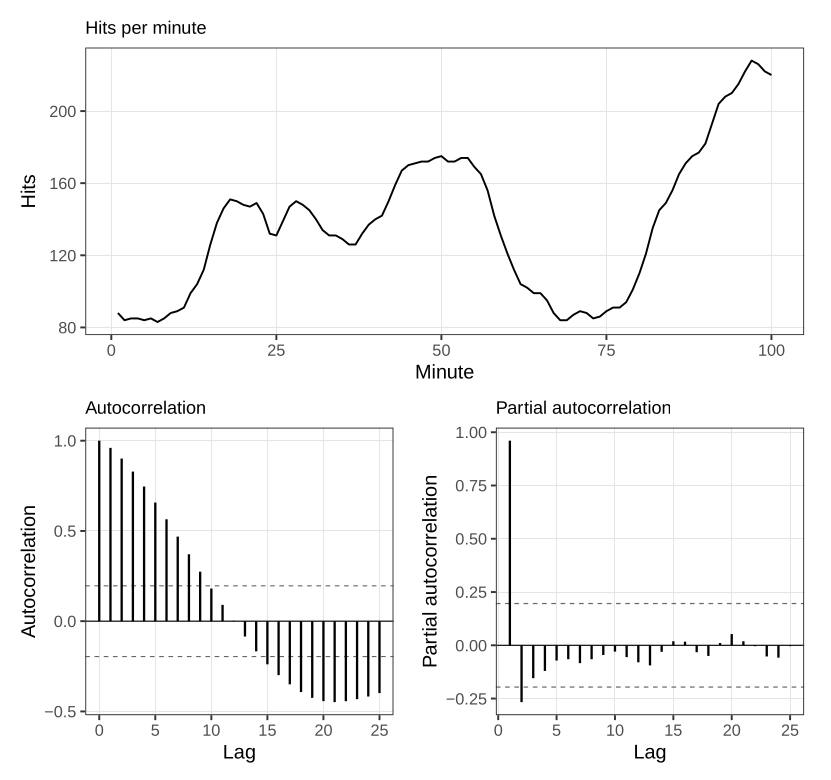
The autocorrelation in Figure 4 dies slowly. The partial autocorrelation dies after a lag or two. After one ordinary difference the series is closer to a flat mean, and auto.arima selects an ARMA(1,1) on that difference:
need <- function(pkg) {
  if (!requireNamespace(pkg, quietly = TRUE)) {
    install.packages(pkg, repos = "https://cloud.r-project.org")
  }
  suppressPackageStartupMessages(library(pkg, character.only = TRUE))
}
need("forecast")
auto.arima(WWWusage, seasonal = TRUE)
The fit has no seasonal piece: one difference, one autoregressive coefficient, and one moving-average coefficient. Both coefficients are positive. A busy minute is followed by a busy minute, and a minute that was busy relative to the minute before it is followed by a minute that is busier still. That is a trend, of the sort a topic has when it is spreading, and it does not need a separate time covariate.
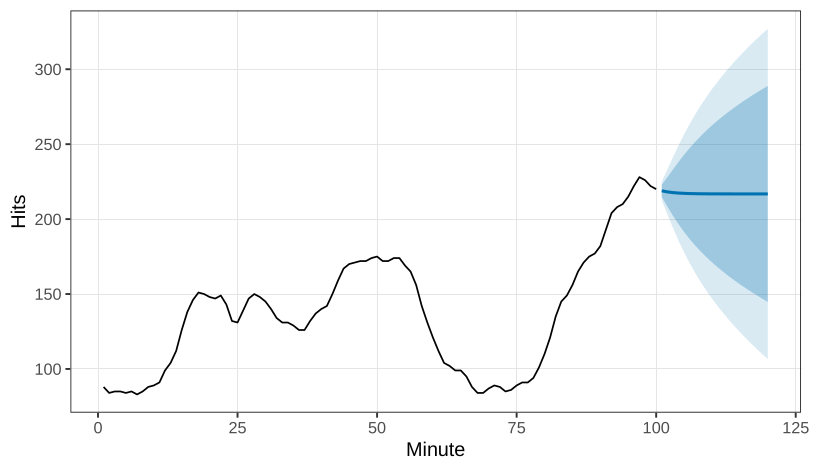
The forecast of the next minutes, in Figure 5, is a shallow line, and the interval widens as the horizon moves away. At a long horizon the forecast has forgotten the local level and sits on the mean that the difference implies.
What this chapter does not cover
Autoregressive conditional heteroscedasticity, and its generalisations, put a time-series model on the variance rather than only on the mean. They are not developed here. Count-valued series are named and not developed, for a reason that has run through the earlier chapters: a Poisson observation is not a mean plus an innovation that can be separated off. Forecasting is the end of the material.
A linear trend, differenced at lag 12, leaves a constant. A quadratic trend, differenced at lag 12, leaves a linear trend. Explain why, for X_t=a+bt+ct^2, the seasonal difference X_t-X_{t-12} still depends on t.
Both MA coefficients in the accidental-death model are negative. State what a negative seasonal MA coefficient says about a year that was worse than the year before it.
Why is exponentiating a forecast made on the log scale not the same object as a forecast of the mean on the original scale?
auto.arimawas not told thatUSAccDeathsis monthly. Which feature of the selected model shows that it found the season anyway?
Questions on this topic
Open a question to attempt it. Its worked answer is folded away at the bottom of the page.
| Question | Answer |
|---|---|
| C47. Unit roots and ARIMA | ✓ |
| C49. Identification and residual checks | ✓ |
What links here
Pages (2)
- Bayesian foundations — via forecasting
- Dependence along a series — via forecasting
Questions and answers (1)