File:clotting.png
Figure file · Underdispersion, positive responses, and quasi-likelihood
Size of this preview: 818 × 520 pixels. Select it to open the high-resolution file.
Summary
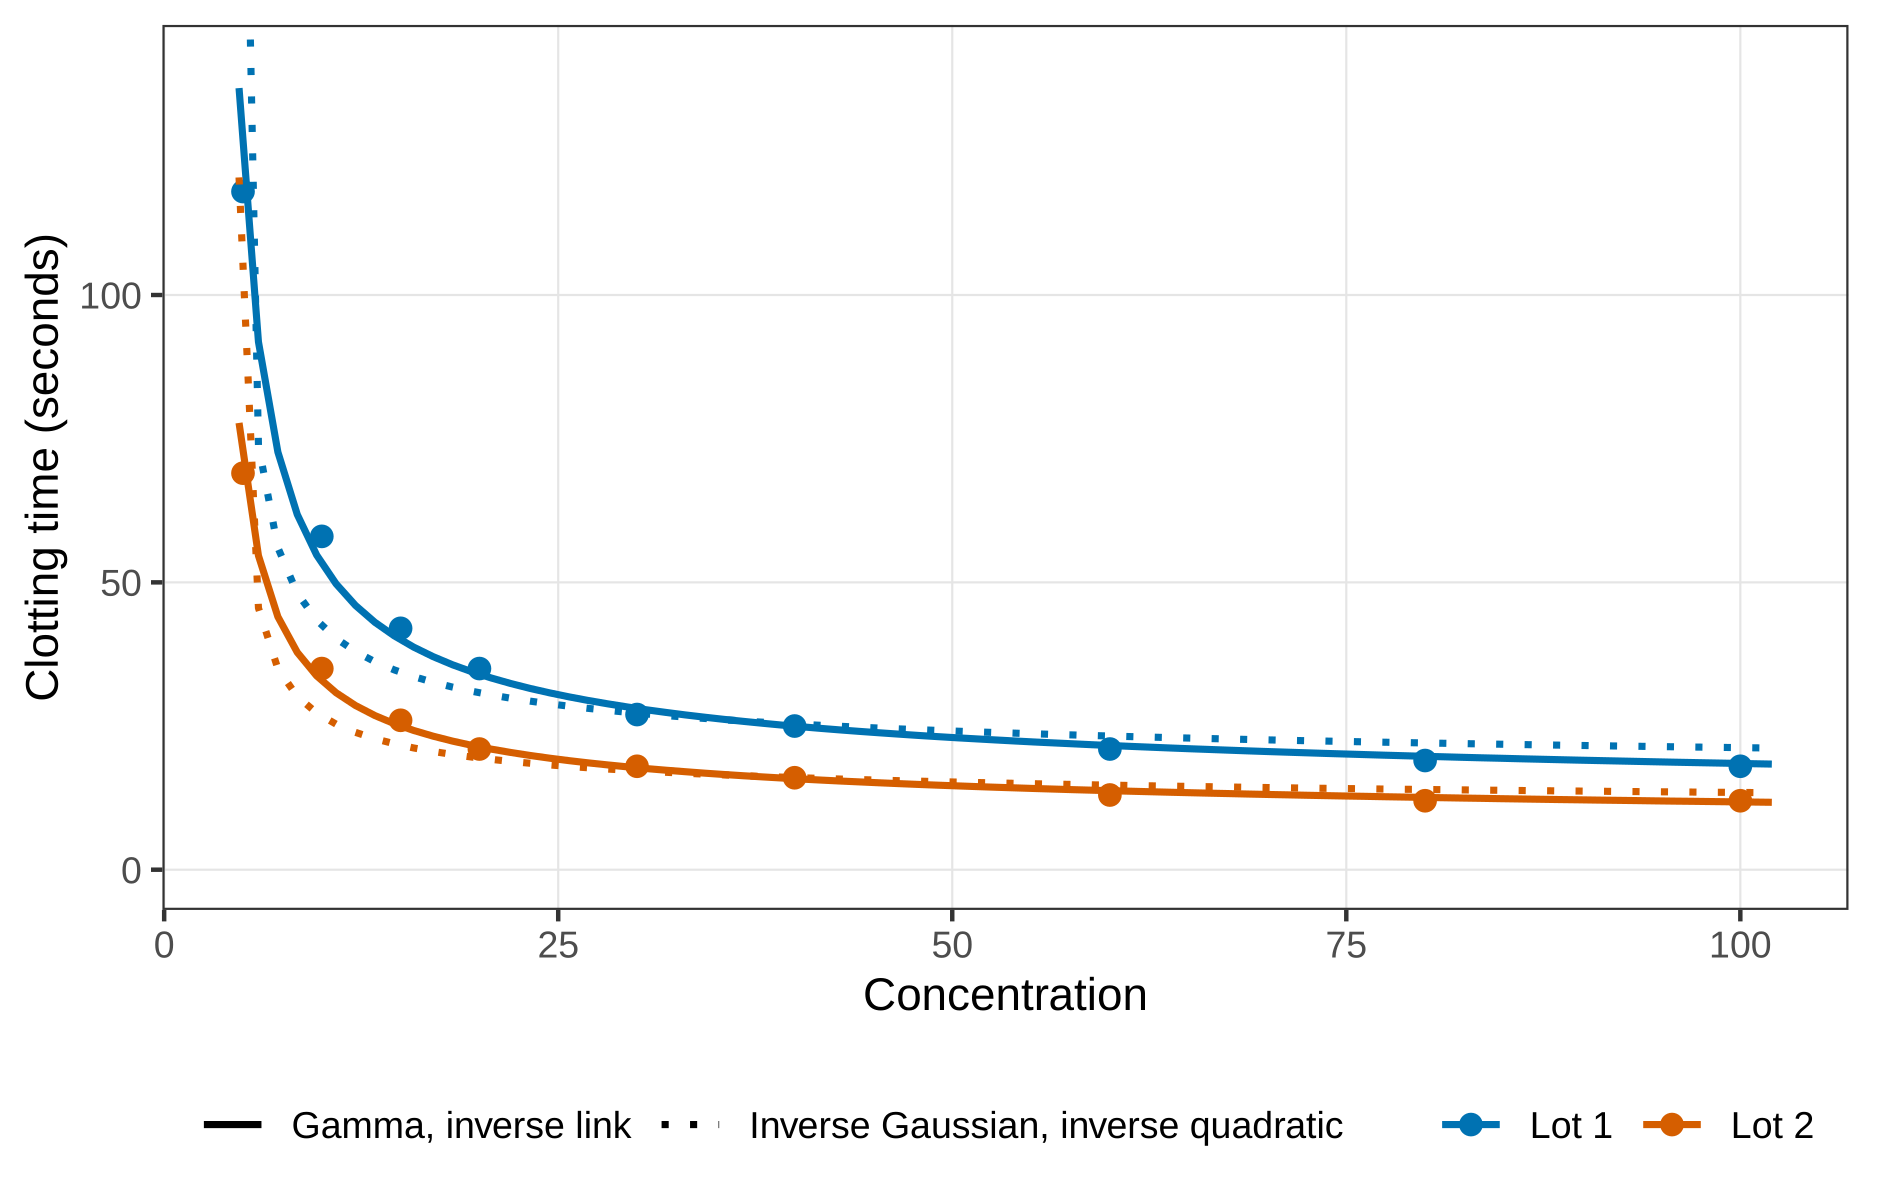
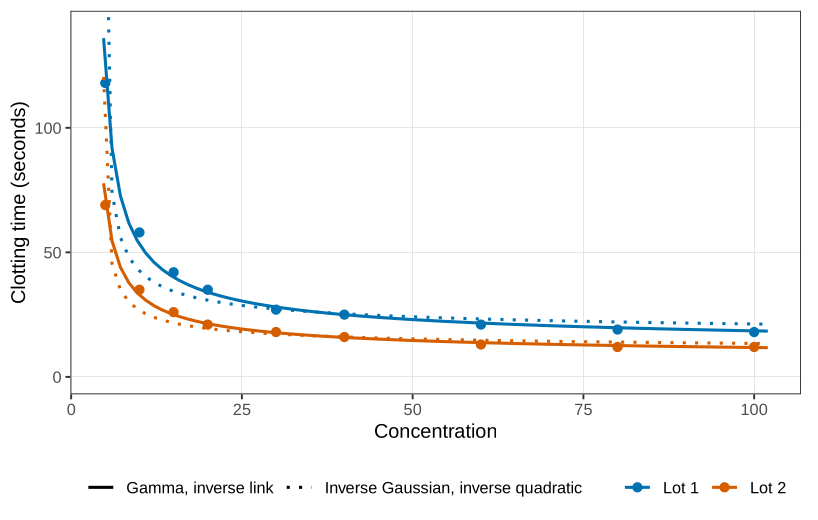
Description. Clotting time against concentration, for the two lots. Solid curves are the gamma model with the inverse link. Dotted curves are the inverse Gaussian with the inverse-quadratic link. The vertical scale stops at 140 seconds; the dotted curves run off the top at low concentration and then flatten below the points.
Appears in. Underdispersion, positive responses, and quasi-likelihood
Made by. A figure from the course chapter.
Download
- PNG, high resolution (1888 × 1200 pixels, 102 KB)
- PNG, as shown on the wiki (818 × 520 pixels, 41 KB)
- PDF, vector, prints at any size (7 KB)
File usage
This page shows the file: