File:da-interaction.png
Figure file · Analysis of variance examples
Size of this preview: 973 × 377 pixels. Select it to open the high-resolution file.
Summary
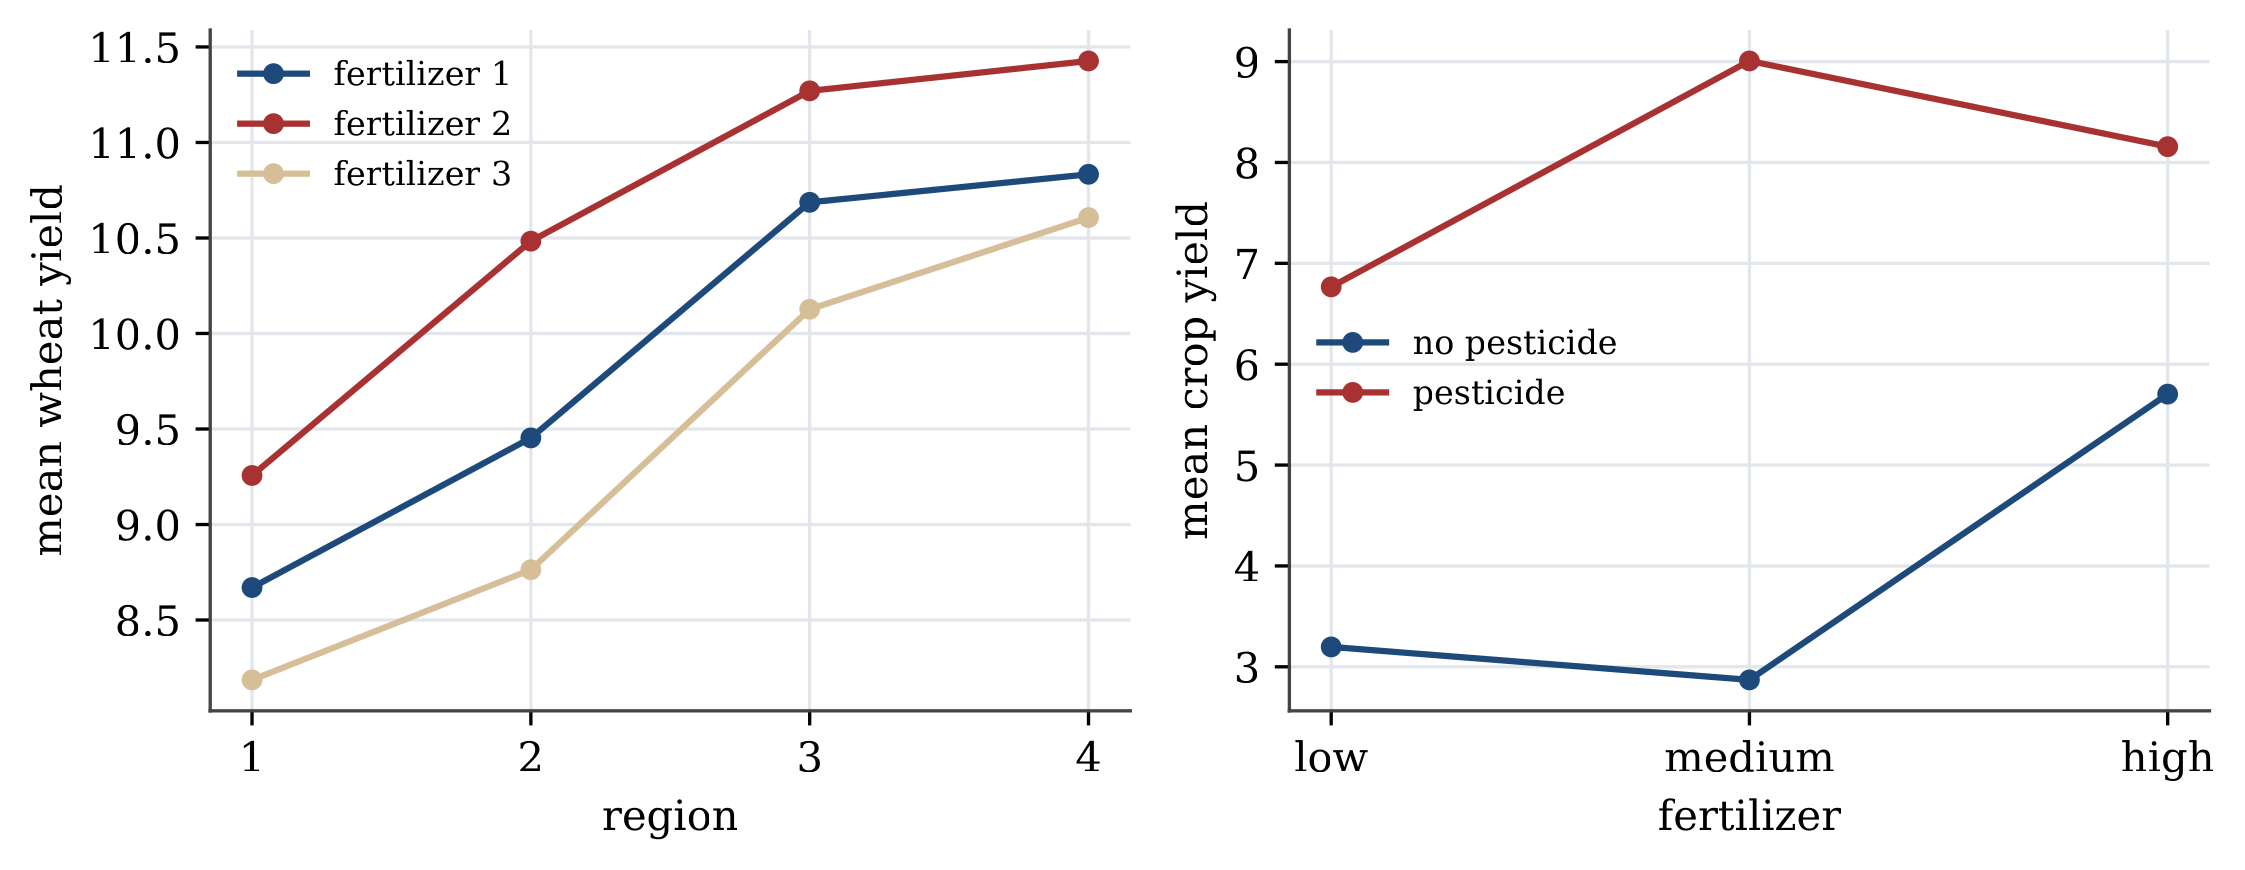
Description. Interaction plots. Left: wheat yield means by region, one line per fertilizer; the lines are nearly parallel, so there is no interaction. Right: crop yield means by fertilizer level, one line per pesticide setting; the lines cross, a strong interaction.
Appears in. Analysis of variance examples
Made by. Drawn with Python and matplotlib from the example data. One script draws every figure in its section.
Download
- PNG, high resolution (2245 × 870 pixels, 138 KB)
- PNG, as shown on the wiki (973 × 377 pixels, 54 KB)
- PDF, vector, prints at any size (17 KB)
- Python script (
stat1301-make_figures.py)
File usage
These 2 pages show the file: