File:deaths-corr.png
Figure file · Forecasting
Size of this preview: 858 × 753 pixels. Select it to open the high-resolution file.
Summary
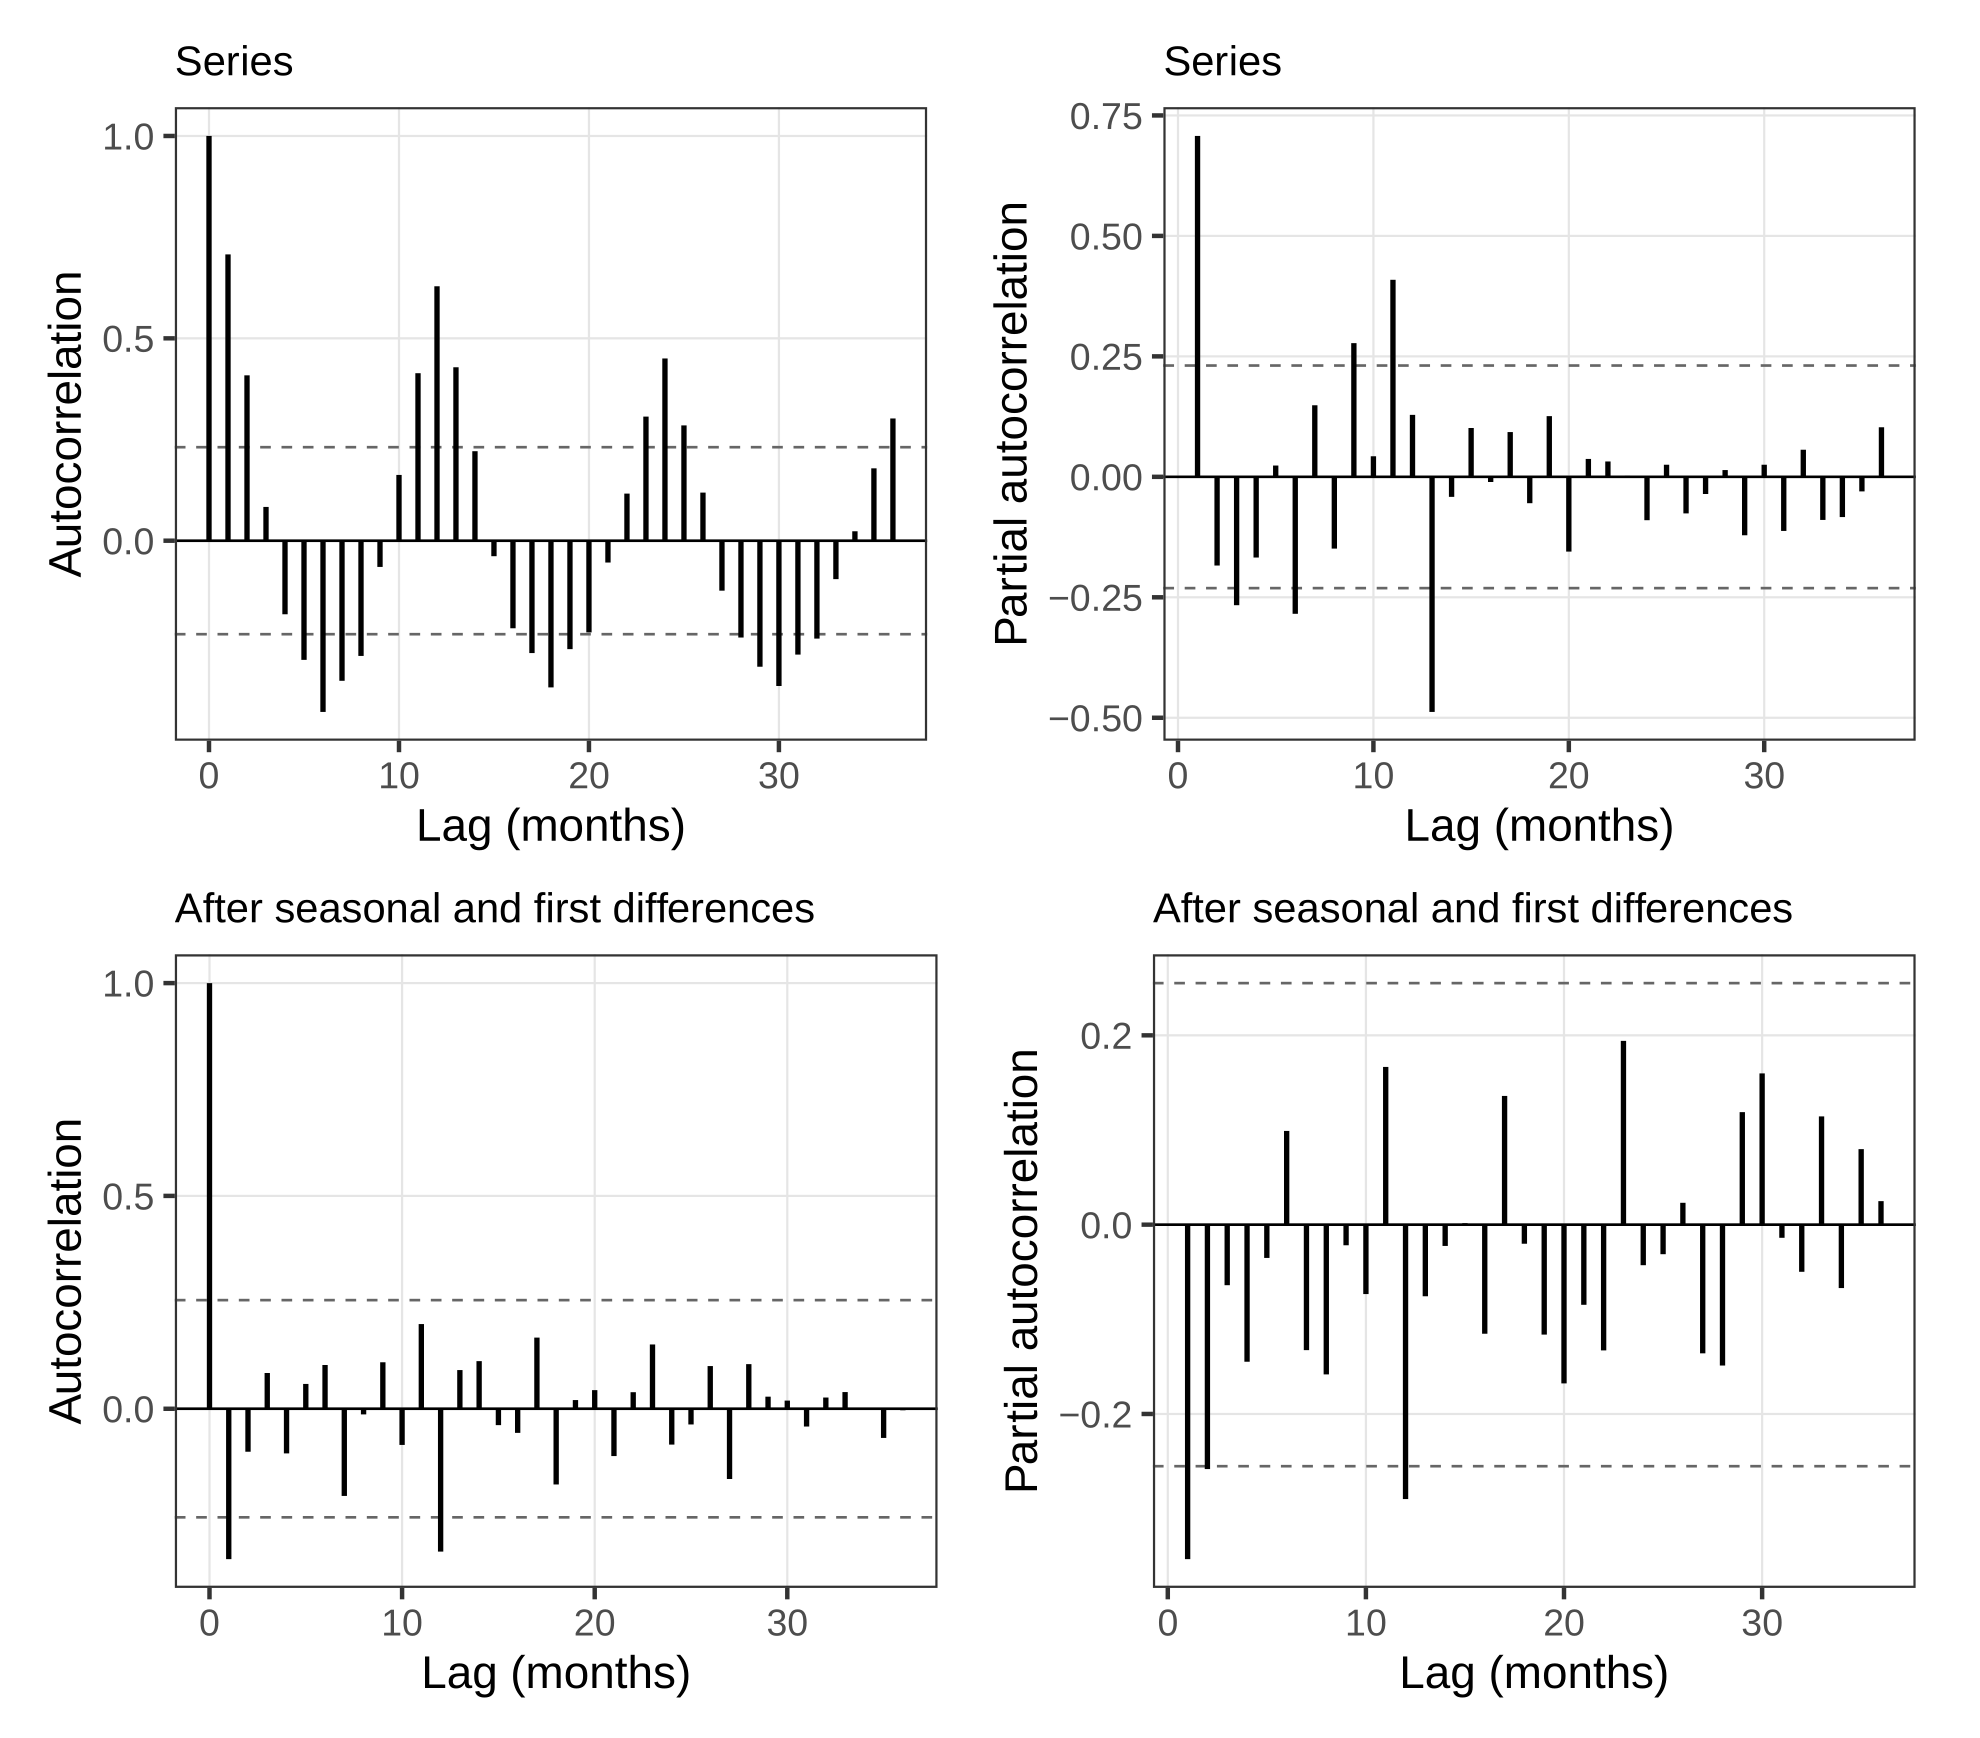
Description. Autocorrelation and partial autocorrelation, in months. The top row is the raw series: neither plot dies, and the year shows up at lags 12 and 24. The bottom row is the series after a seasonal difference and a first difference. What remains is a spike at lag 1 and a spike near lag 12.
Appears in. Forecasting
Made by. A figure from the course chapter.
Download
- PNG, high resolution (1980 × 1738 pixels, 144 KB)
- PNG, as shown on the wiki (858 × 753 pixels, 64 KB)
- PDF, vector, prints at any size (7 KB)
File usage
This page shows the file: