File:inf-coverage.png
Figure file · Confidence intervals
Size of this preview: 812 × 443 pixels. Select it to open the high-resolution file.
Summary
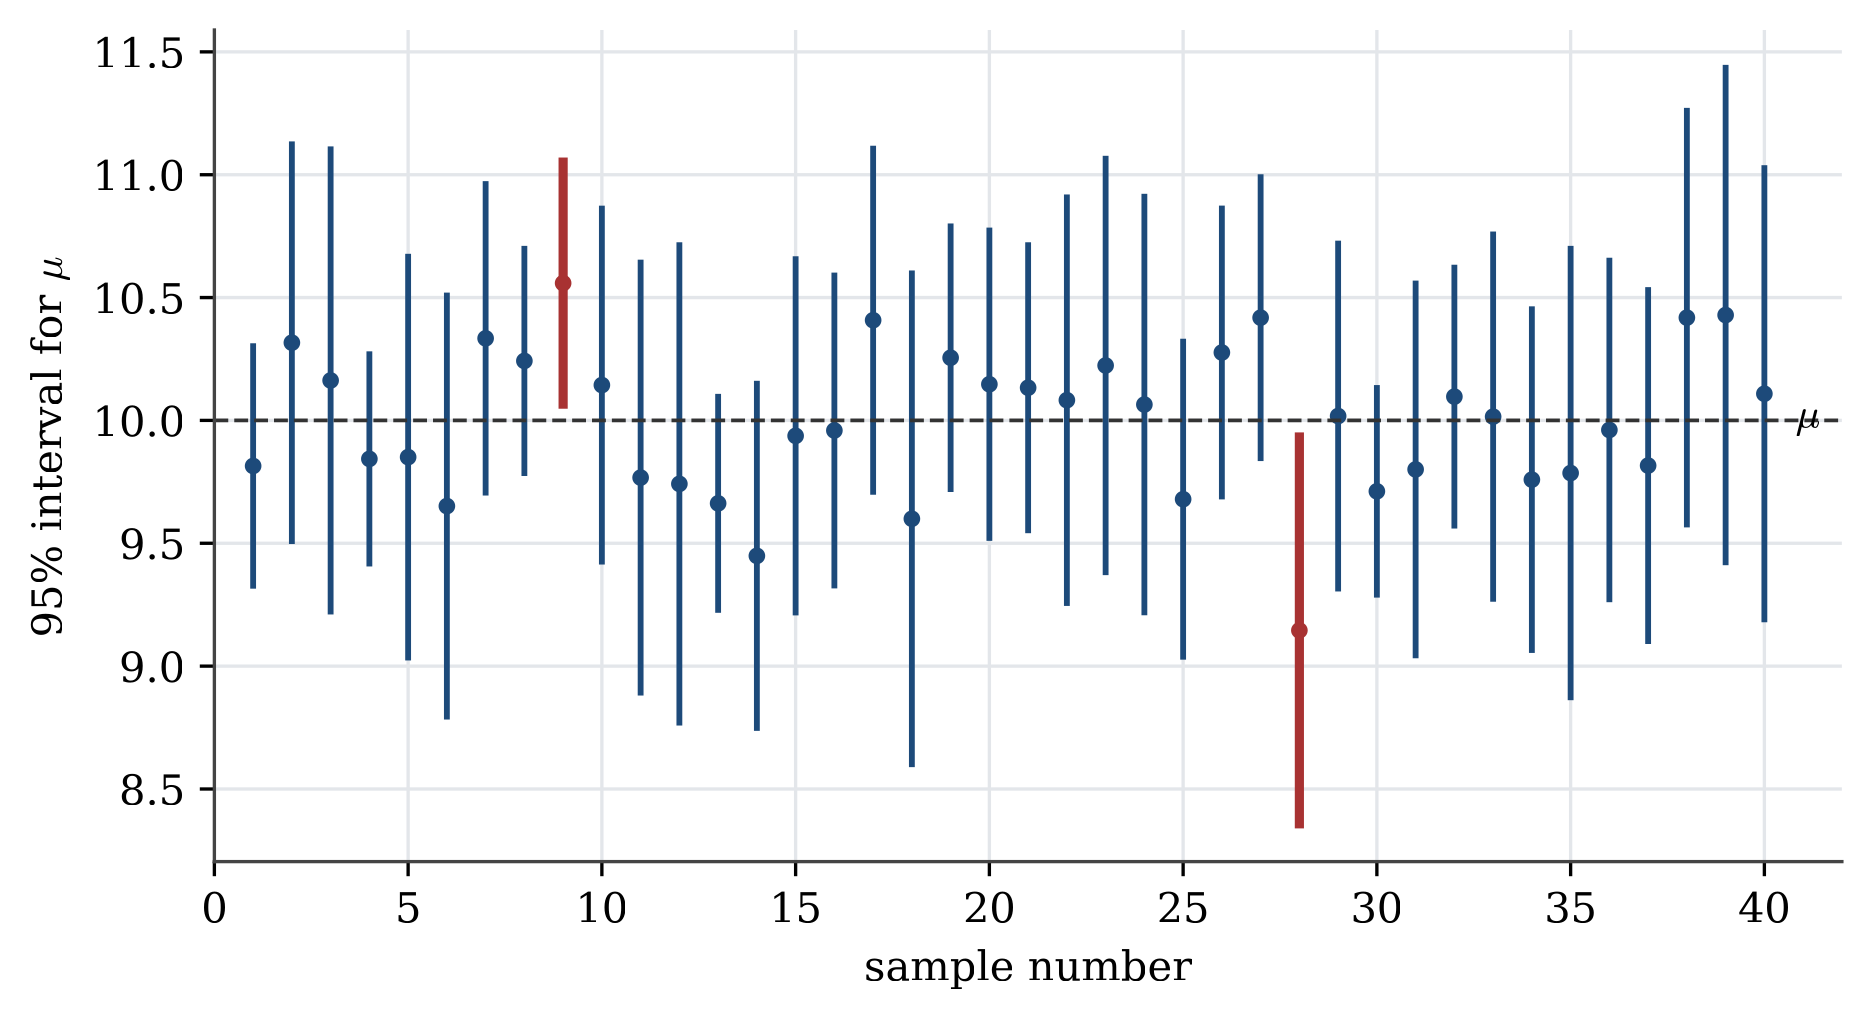
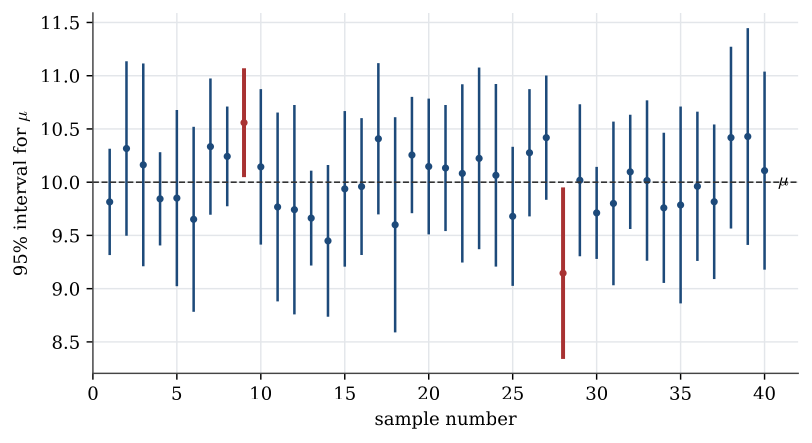
Description. Forty samples of size 10 from \operatorname{N}(10,1), each with its 95% t interval for \mu. Thirty-eight cover \mu=10. The two in red miss it. In repeated sampling about 5% of such intervals miss, and nothing in an interval’s own data shows whether it is one of them.
Appears in. Confidence intervals
Made by. Drawn with Python and matplotlib from the example data. One script draws every figure in its section.
Download
- PNG, high resolution (1872 × 1021 pixels, 65 KB)
- PNG, as shown on the wiki (812 × 443 pixels, 31 KB)
- PDF, vector, prints at any size (20 KB)
- Python script (
stat2004-make_figures.py)
File usage
These 2 pages show the file: