File:leaf-residuals.png
Figure file · Underdispersion, positive responses, and quasi-likelihood
Size of this preview: 858 × 468 pixels. Select it to open the high-resolution file.
Summary
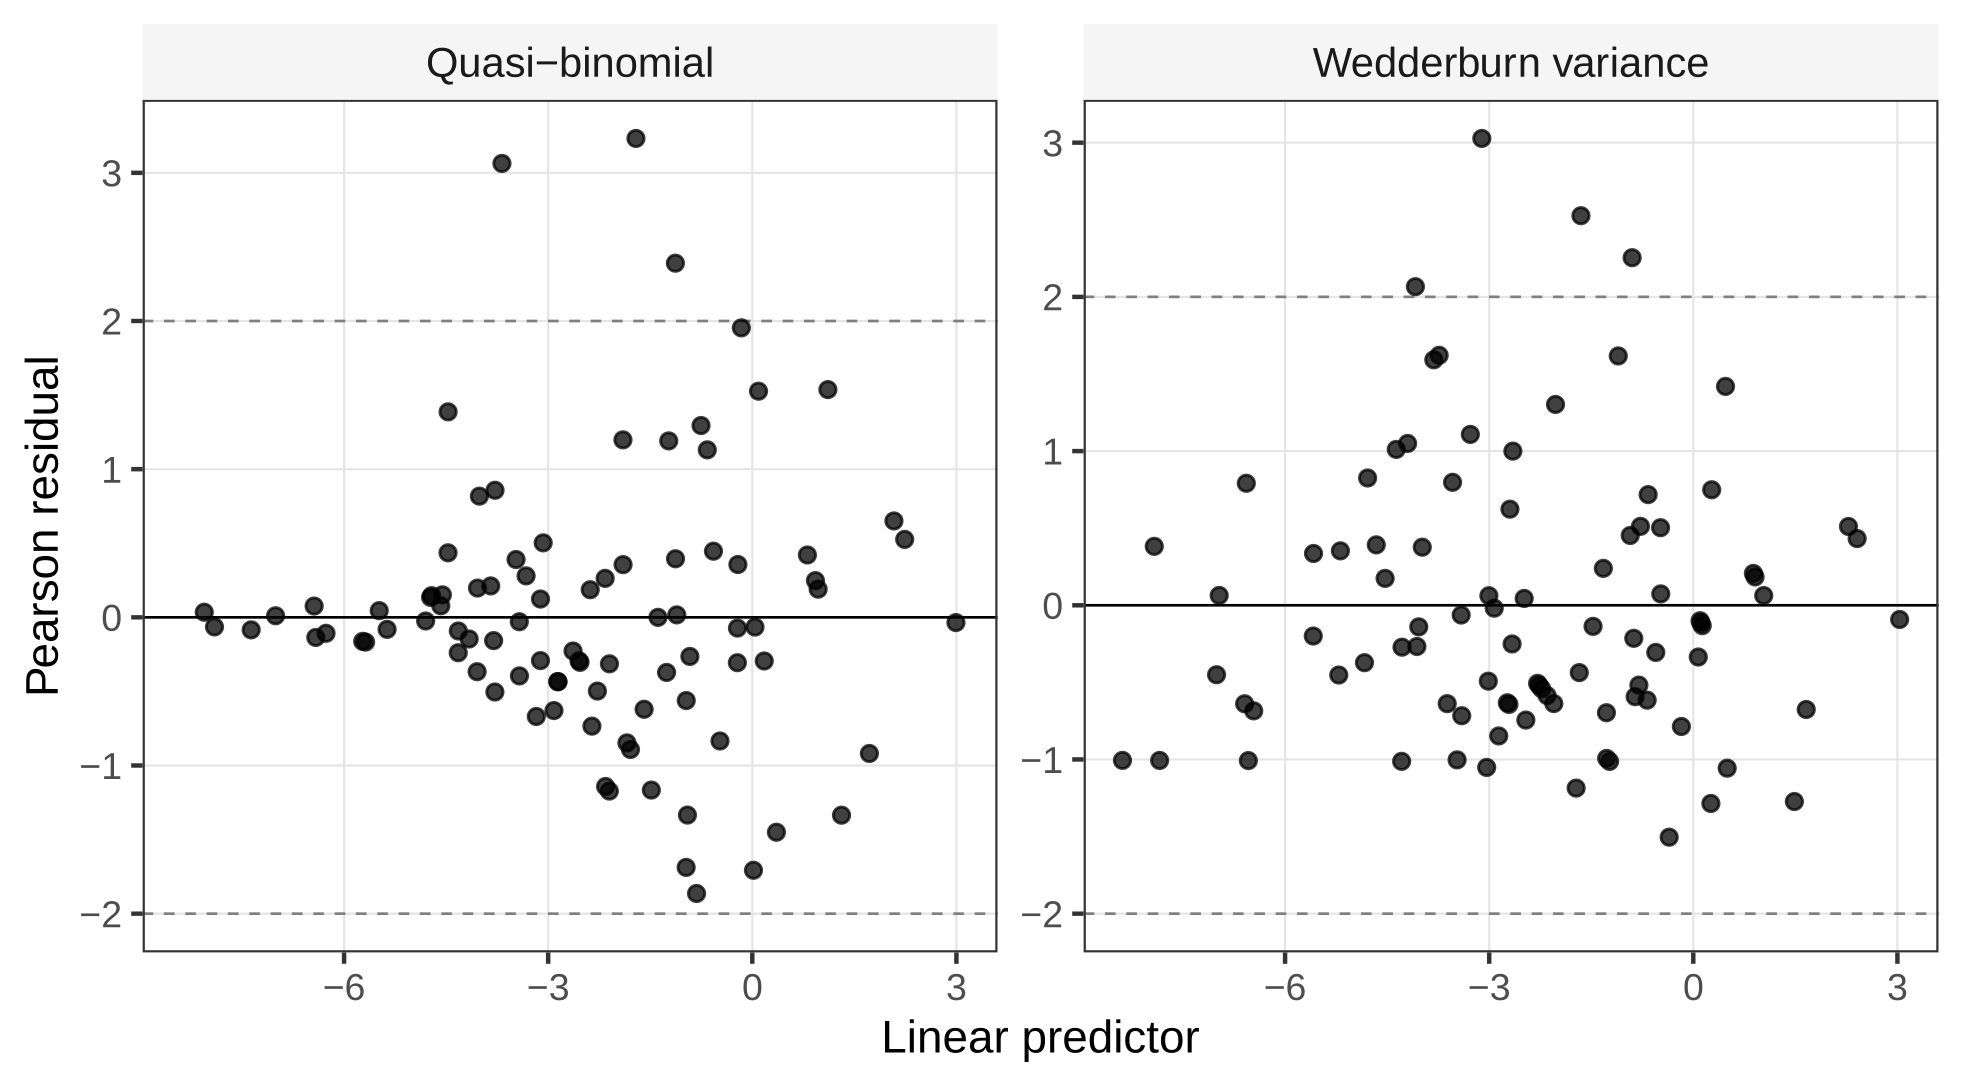
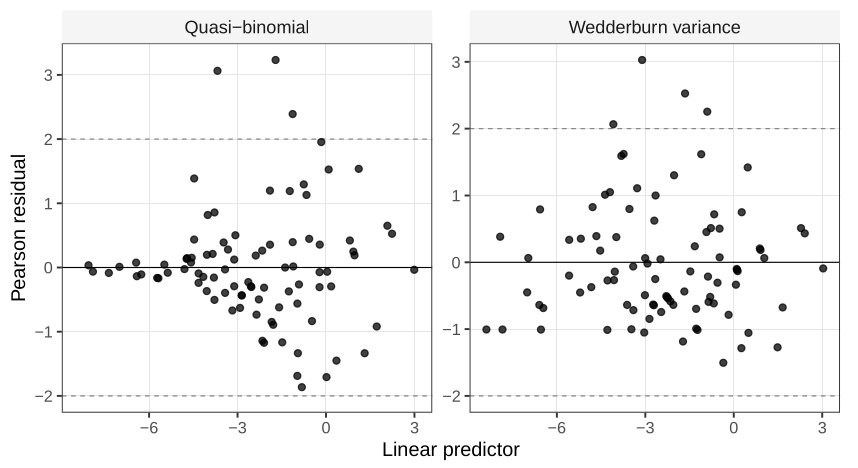
Description. Pearson residuals against the linear predictor. On the left the quasi-binomial variance squeezes the small fitted values, at the left of the panel, onto the horizontal axis. On the right, Wedderburn’s variance gives those same points more room. Dashed lines are at plus or minus 2.
Appears in. Underdispersion, positive responses, and quasi-likelihood
Made by. A figure from the course chapter.
Download
- PNG, high resolution (1980 × 1080 pixels, 168 KB)
- PNG, as shown on the wiki (858 × 468 pixels, 58 KB)
- PDF, vector, prints at any size (16 KB)
File usage
These 2 pages show the file: