File:pit.png
Figure file · Probability-integral residuals
Size of this preview: 858 × 481 pixels. Select it to open the high-resolution file.
Summary
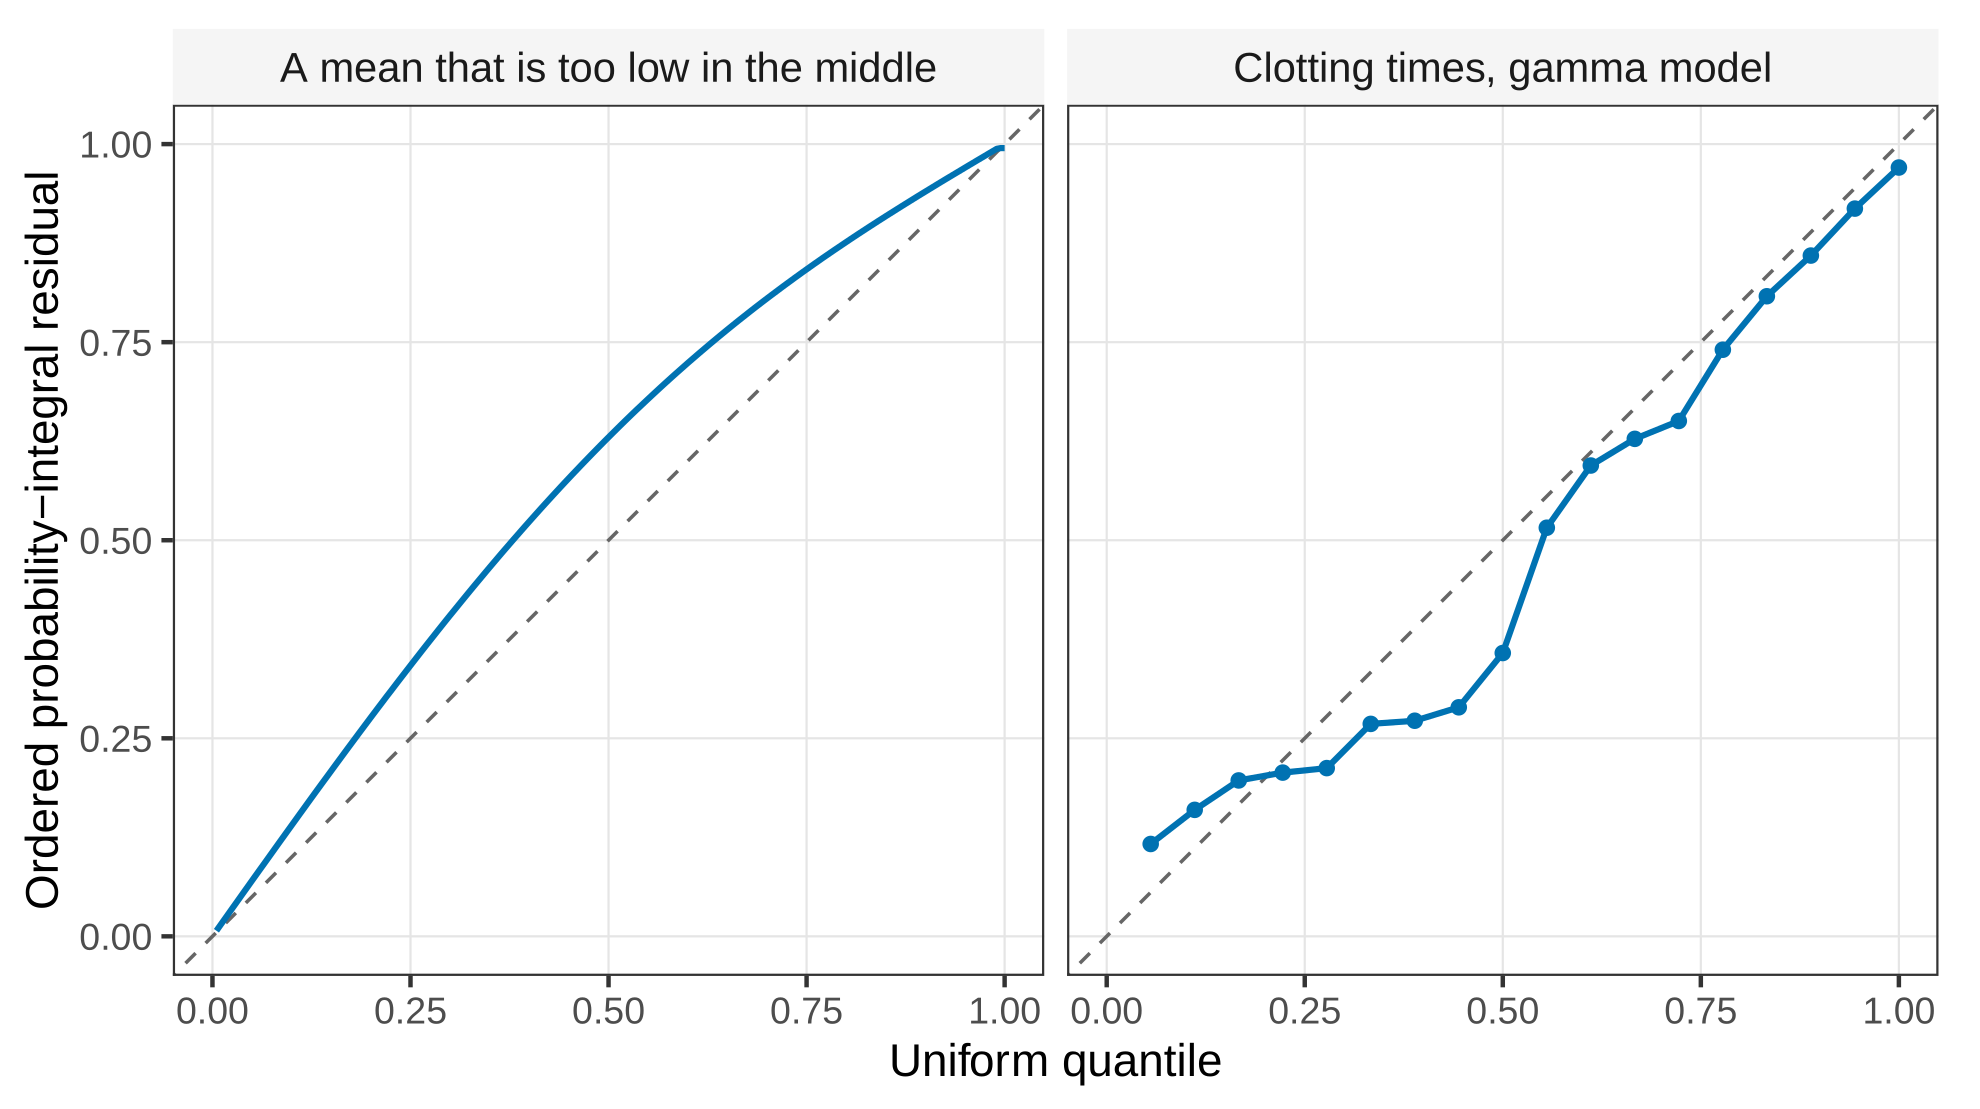
Description. Left: probability-integral residuals from the gamma clotting fit, plotted against equally spaced uniform quantiles. The dashed line is what an adequate fit looks like; eighteen points still wiggle around it. Right: the bow described above, not a fit to a data set. Above the diagonal through the middle means the middle observations are larger than the fitted distribution expected.
Appears in. Probability-integral residuals
Made by. A figure from the course chapter.
Download
- PNG, high resolution (1980 × 1109 pixels, 118 KB)
- PNG, as shown on the wiki (858 × 481 pixels, 46 KB)
- PDF, vector, prints at any size (7 KB)
File usage
This page shows the file: