File:pneumonia.png
Figure file · Categorical responses
Size of this preview: 818 × 493 pixels. Select it to open the high-resolution file.
Summary
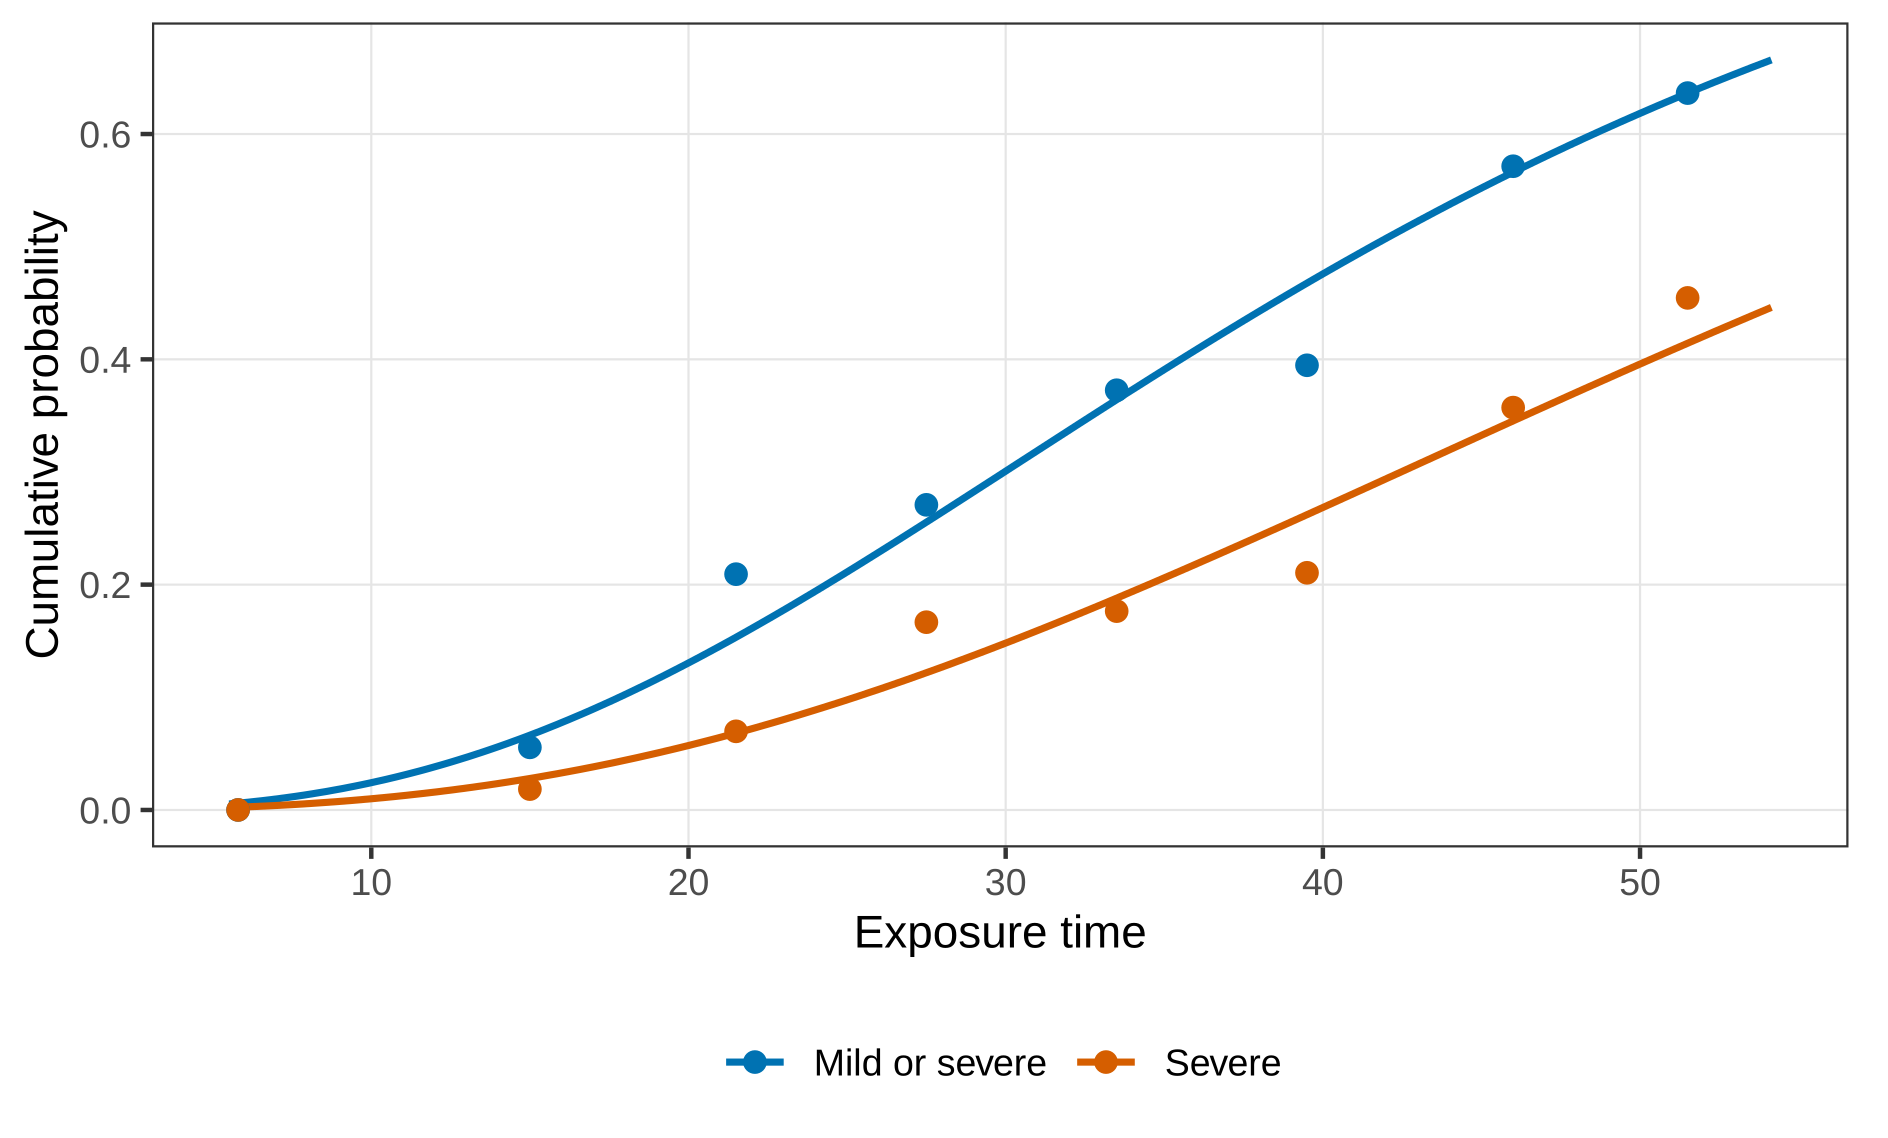
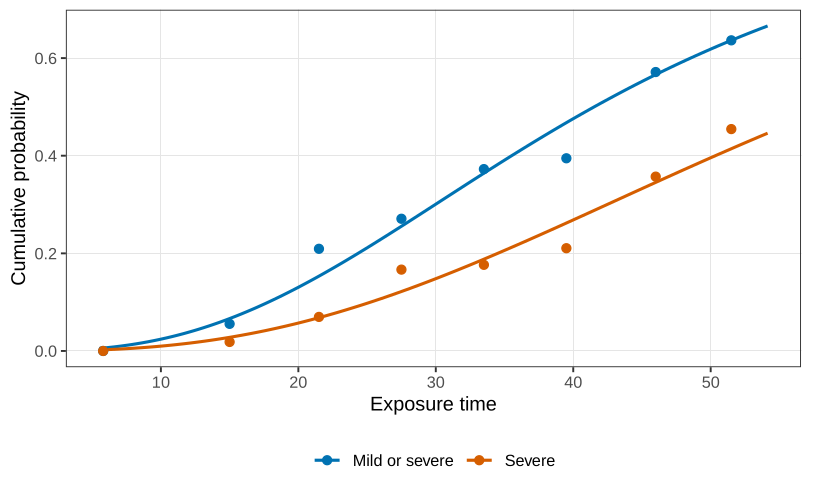
Description. Fitted cumulative probabilities against exposure time. The severe curve stays below the curve for mild or severe, and the two curves share a slope on the logit scale. Points are the proportions in the table.
Appears in. Categorical responses
Made by. A figure from the course chapter.
Download
- PNG, high resolution (1888 × 1138 pixels, 93 KB)
- PNG, as shown on the wiki (818 × 493 pixels, 36 KB)
- PDF, vector, prints at any size (8 KB)
File usage
These 2 pages show the file: