File:prob-weibull-hazards.png
Figure file · Reliability
Size of this preview: 800 × 390 pixels. Select it to open the high-resolution file.
Summary
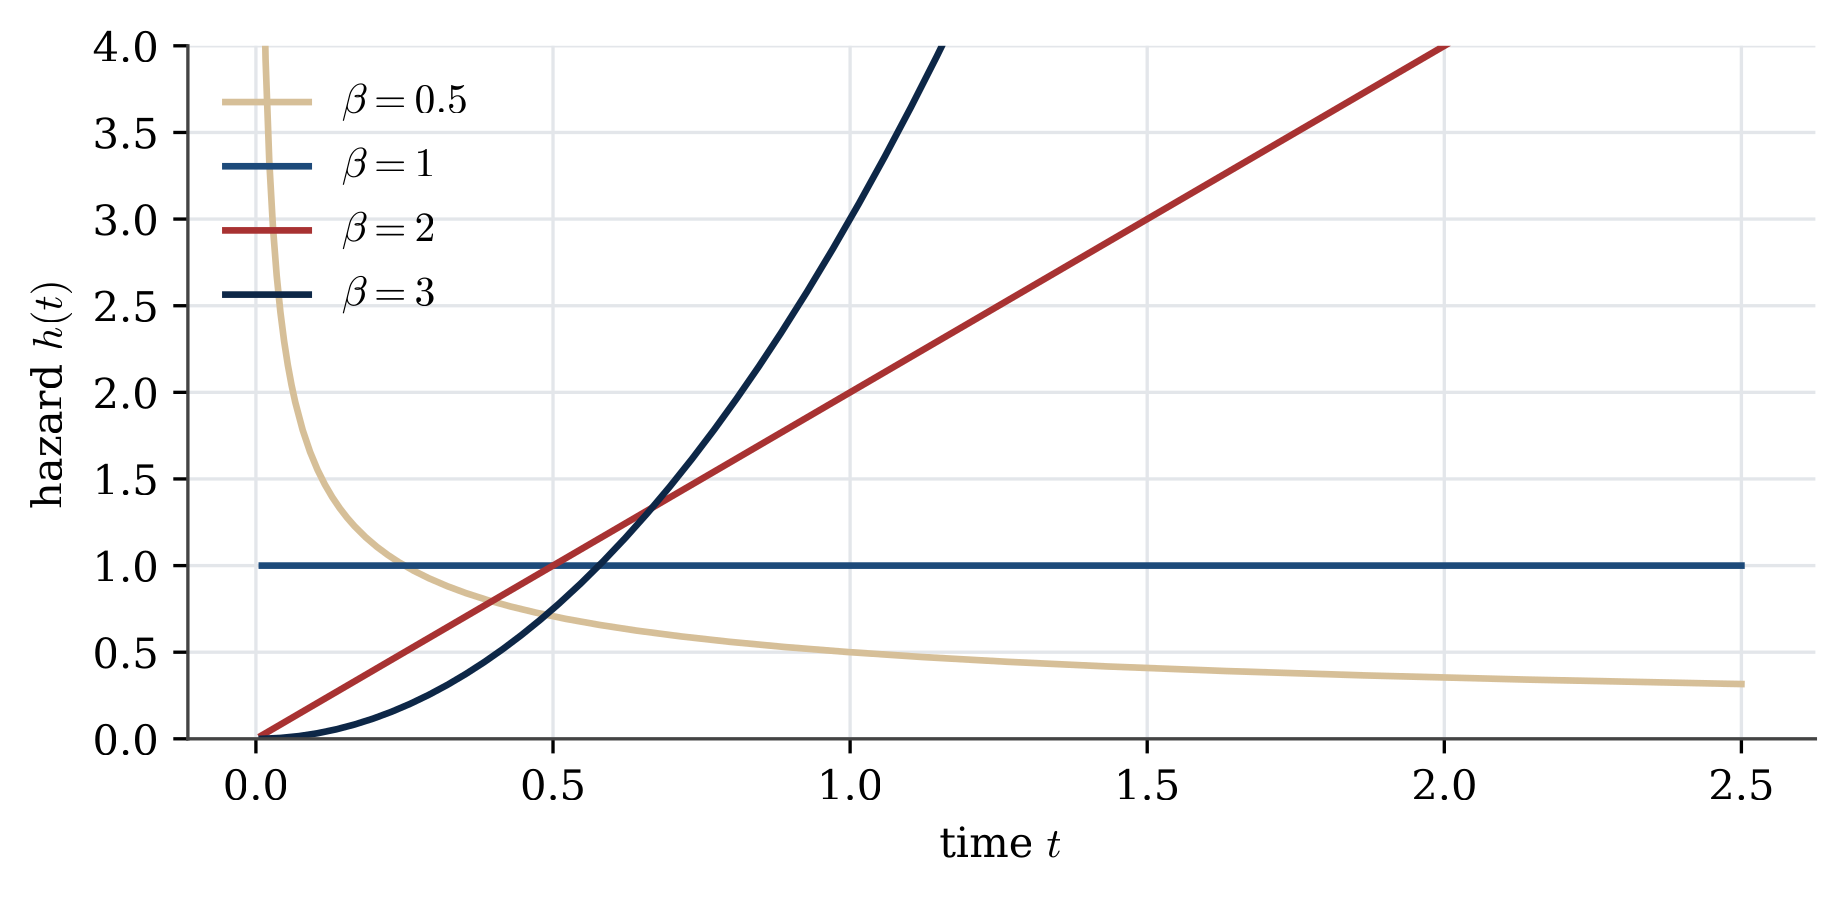
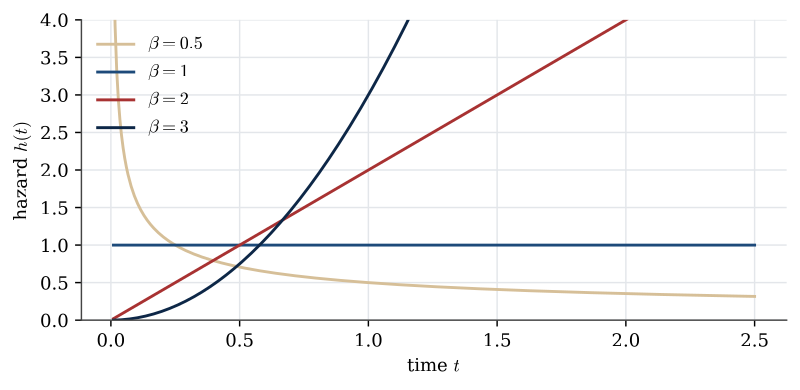
Description. Weibull hazard rates with rate \lambda=1. Shape \beta<1 gives a falling hazard, as when weak units fail early; \beta=1 is the constant exponential hazard; \beta>1 gives wear-out. Real equipment often shows all three phases in turn, the bathtub curve.
Appears in. Reliability
Made by. Drawn with Python and matplotlib from the example data. One script draws every figure in its section.
Download
- PNG, high resolution (1846 × 900 pixels, 94 KB)
- PNG, as shown on the wiki (800 × 390 pixels, 35 KB)
- PDF, vector, prints at any size (18 KB)
- Python script (
stat2003-make_figures.py)
File usage
These 3 pages show the file: