File:sleep.png
Figure file · Random slopes, and a binary mixed model
Size of this preview: 818 × 520 pixels. Select it to open the high-resolution file.
Summary
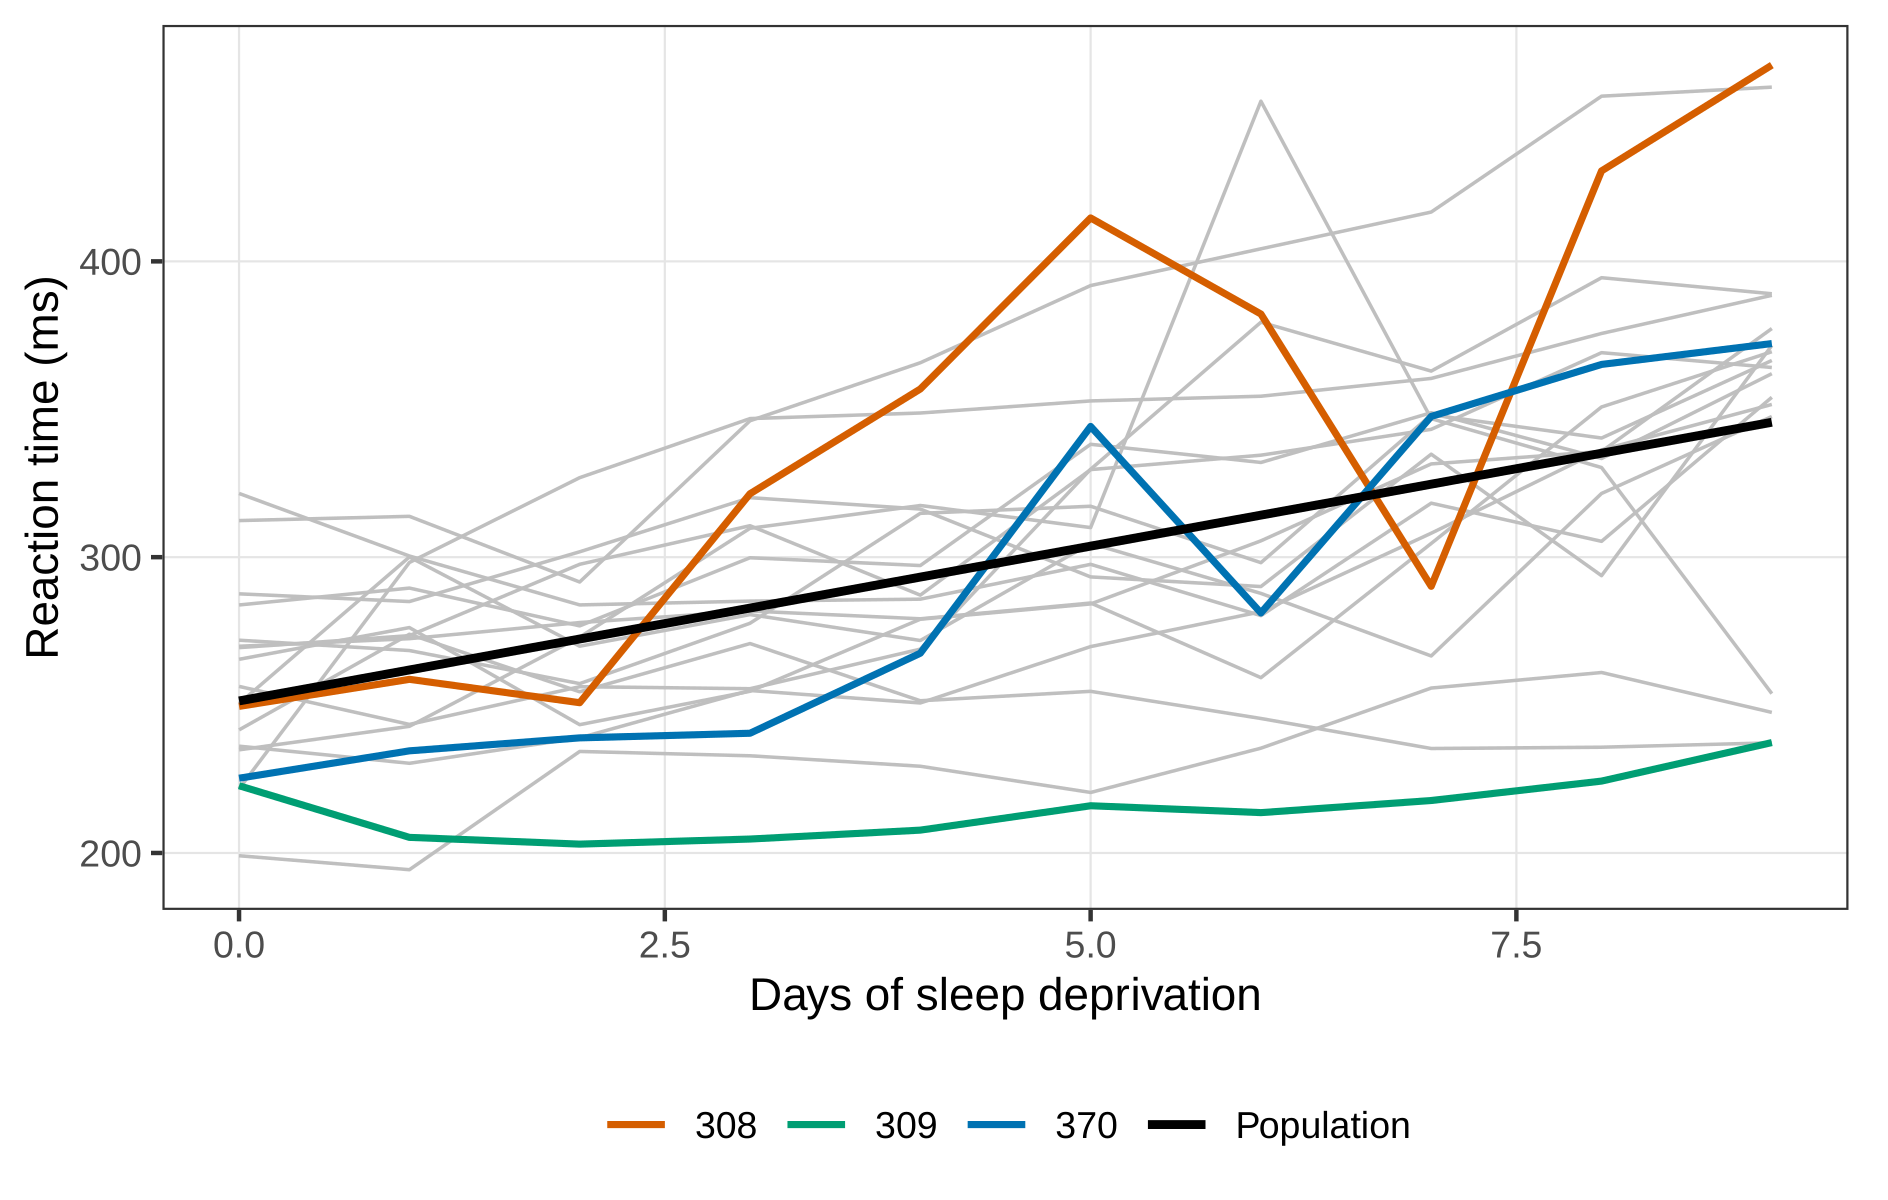
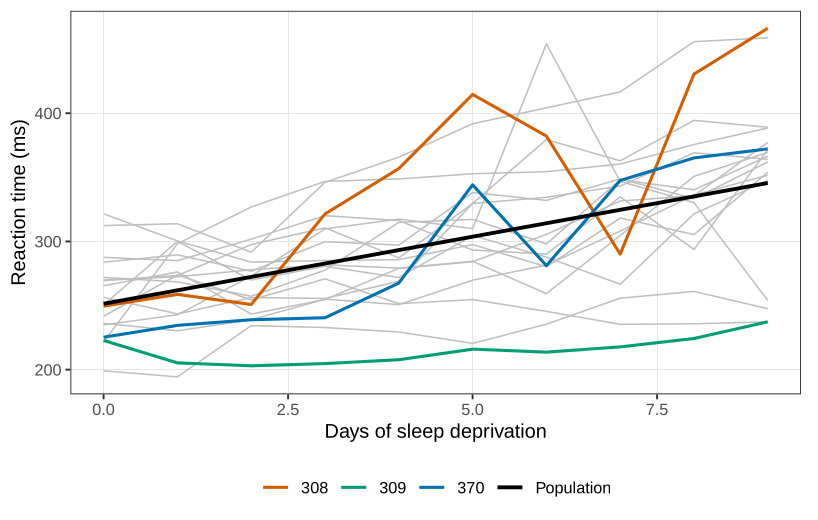
Description. Reaction time for the eighteen subjects. The black line is the population fit, about 251 milliseconds plus 10.5 milliseconds a day. Subjects 308, 309 and 370 are marked. Subject 309 is the flat series.
Appears in. Random slopes, and a binary mixed model
Made by. A figure from the course chapter.
Download
- PNG, high resolution (1888 × 1200 pixels, 237 KB)
- PNG, as shown on the wiki (818 × 520 pixels, 88 KB)
- PDF, vector, prints at any size (5 KB)
File usage
This page shows the file: