Five-number summary and boxplot
Definition taught in Descriptive statistics, part of Data analysis
Five-number summary and boxplot
| Type | Definition |
| Taught in | Descriptive statistics |
| Part | Data analysis |
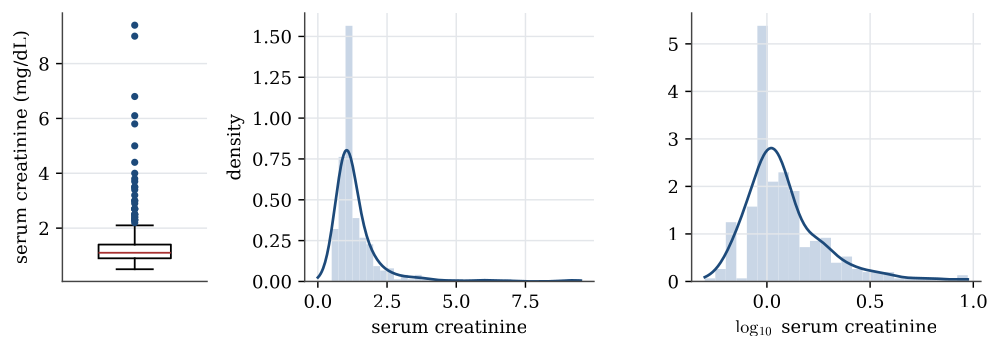
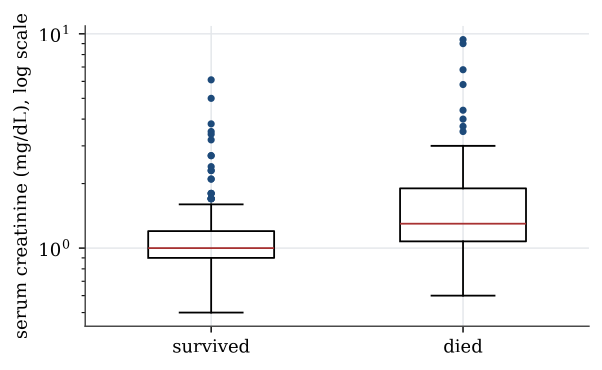
The five-number summary of a sample is its minimum, first quartile, median, third quartile and maximum. A boxplot draws the box from the first to the third quartile with a line at the median, and whiskers out to the most extreme data within 1.5 interquartile ranges of the box. Points beyond the whiskers are drawn individually as possible outliers.
Figures
Used in
- Taught in Descriptive statistics, where the derivation and examples are.
- Also used in Regression examples
- All 2 questions on Descriptive statistics
See also
Sample quantile · Interquartile range · Sample variance and standard deviation · Normal quantile plot