Normal quantile plot
Definition taught in Descriptive statistics, part of Data analysis
Normal quantile plot
| Type | Definition |
| Taught in | Descriptive statistics |
| Part | Data analysis |
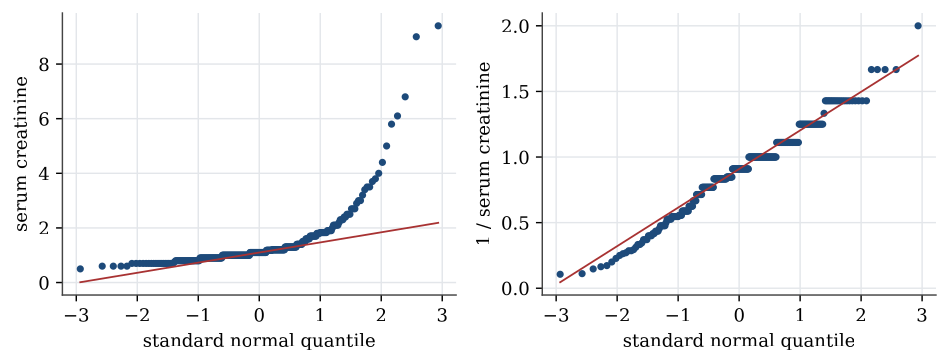
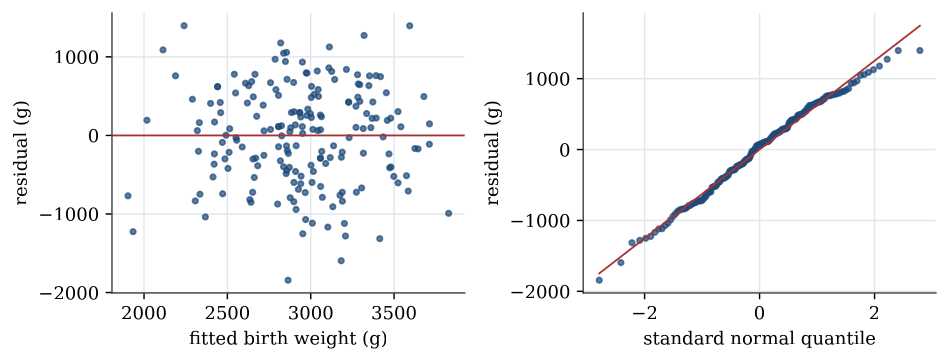
A normal quantile plot, or Q–Q plot, plots the sorted data against the quantiles of the standard normal distribution at the same fractions. If the data come from a normal distribution, the points lie close to a straight line, whose intercept and slope estimate the mean and standard deviation.
Figures
Used in
- Taught in Descriptive statistics, where the derivation and examples are.
- Also used in Analysis of variance examples · Regression examples · Linear model examples
- All 2 questions on Descriptive statistics
See also
Normal distribution · Sample quantile · Interquartile range · Sample variance and standard deviation · Five-number summary and boxplot