Pearson chi-squared approximation
Theorem taught in Chi-squared tests, part of Statistical inference
Pearson chi-squared approximation
| Type | Theorem |
| Taught in | Chi-squared tests |
| Part | Statistical inference |
| Worked examples | 2 |
If p_i=\pi_i for every i, the Pearson statistic T has approximately the \chi^2_{k-1} distribution for large n.
Examples
Frizzled chickens
Worked example from Chi-squared tests
Genetic theory predicts that chickens of types FF, Ff and ff, which are extremely frizzled, slightly frizzled and normal, occur in proportions 1:2:1. Of 93 chickens, 23, 50 and 20 are of the three types.
Question. Are the counts consistent with the theory, at level 0.05?
Solution. The counts are \operatorname{Multinomial}(93;\,p_1,p_2,p_3). Test H_0:(p_1,p_2,p_3)=(1/4,1/2,1/4). The expected counts are 23.25, 46.5 and 23.25, and
T=\frac{(23-23.25)^2}{23.25}+\frac{(50-46.5)^2}{46.5}+\frac{(20-23.25)^2}{23.25}=0.003+0.263+0.454=0.72,
on 3-1=2 degrees of freedom. The critical value is \chi^2_{2;0.95}=5.991, and the p-value is 0.70. The counts are consistent with the 1:2:1 theory.
A hundred balls in ten boxes
Worked example from Chi-squared examples
Throw n=100 balls at random into k=10 boxes, each equally likely. The counts are multinomial, and each expected count is 10.
Question. What is the distribution of the Pearson statistic, and does it match \chi^2_9?
Solution. One throw gave the counts 14, 6, 13, 12, 11, 12, 5, 11, 7, 9, for which
T=\sum_{i=1}^{10}\frac{(x_i-10)^2}{10}=\frac{16+16+9+4+1+4+25+1+9+1}{10}=8.6.
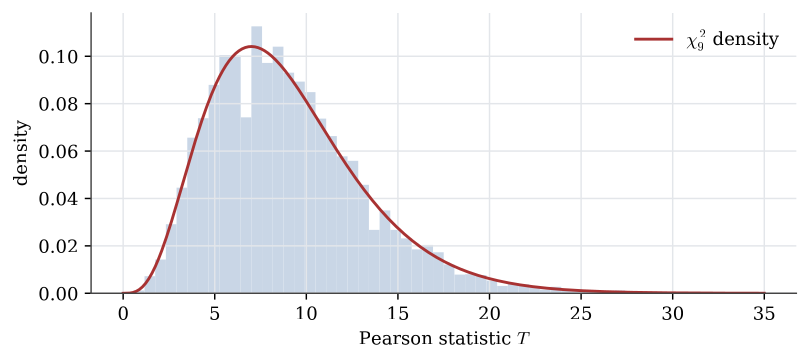
Repeating the experiment many times gives the distribution of T:
R <- 10000
t <- replicate(R, {
  counts <- tabulate(sample(1:10, size = 100, replace = TRUE), nbins = 10)
  sum((counts - 10)^2 / 10)
})
hist(t, breaks = 40, freq = FALSE)
curve(dchisq(x, df = 9), add = TRUE, col = 2, lwd = 2)
mean(t > qchisq(0.95, df = 9))     # close to 0.05
The histogram follows the \chi^2_9 density closely, and about 5% of the simulated statistics exceed the \chi^2_9 quantile 16.92, as they should under the null hypothesis. With 10 balls instead of 100, each expected count would be 1, far below the rule of thumb of 5, and the approximation would visibly fail.
Used in
- Taught in Chi-squared tests, where the derivation and examples are.
- All 4 questions on Chi-squared tests
See also
Pearson statistic · Pearson test with estimated parameters · Chi-squared test of independence