File:da-creatinine-shape.png
Figure file · Descriptive statistics
Size of this preview: 1001 × 353 pixels. Select it to open the high-resolution file.
Summary
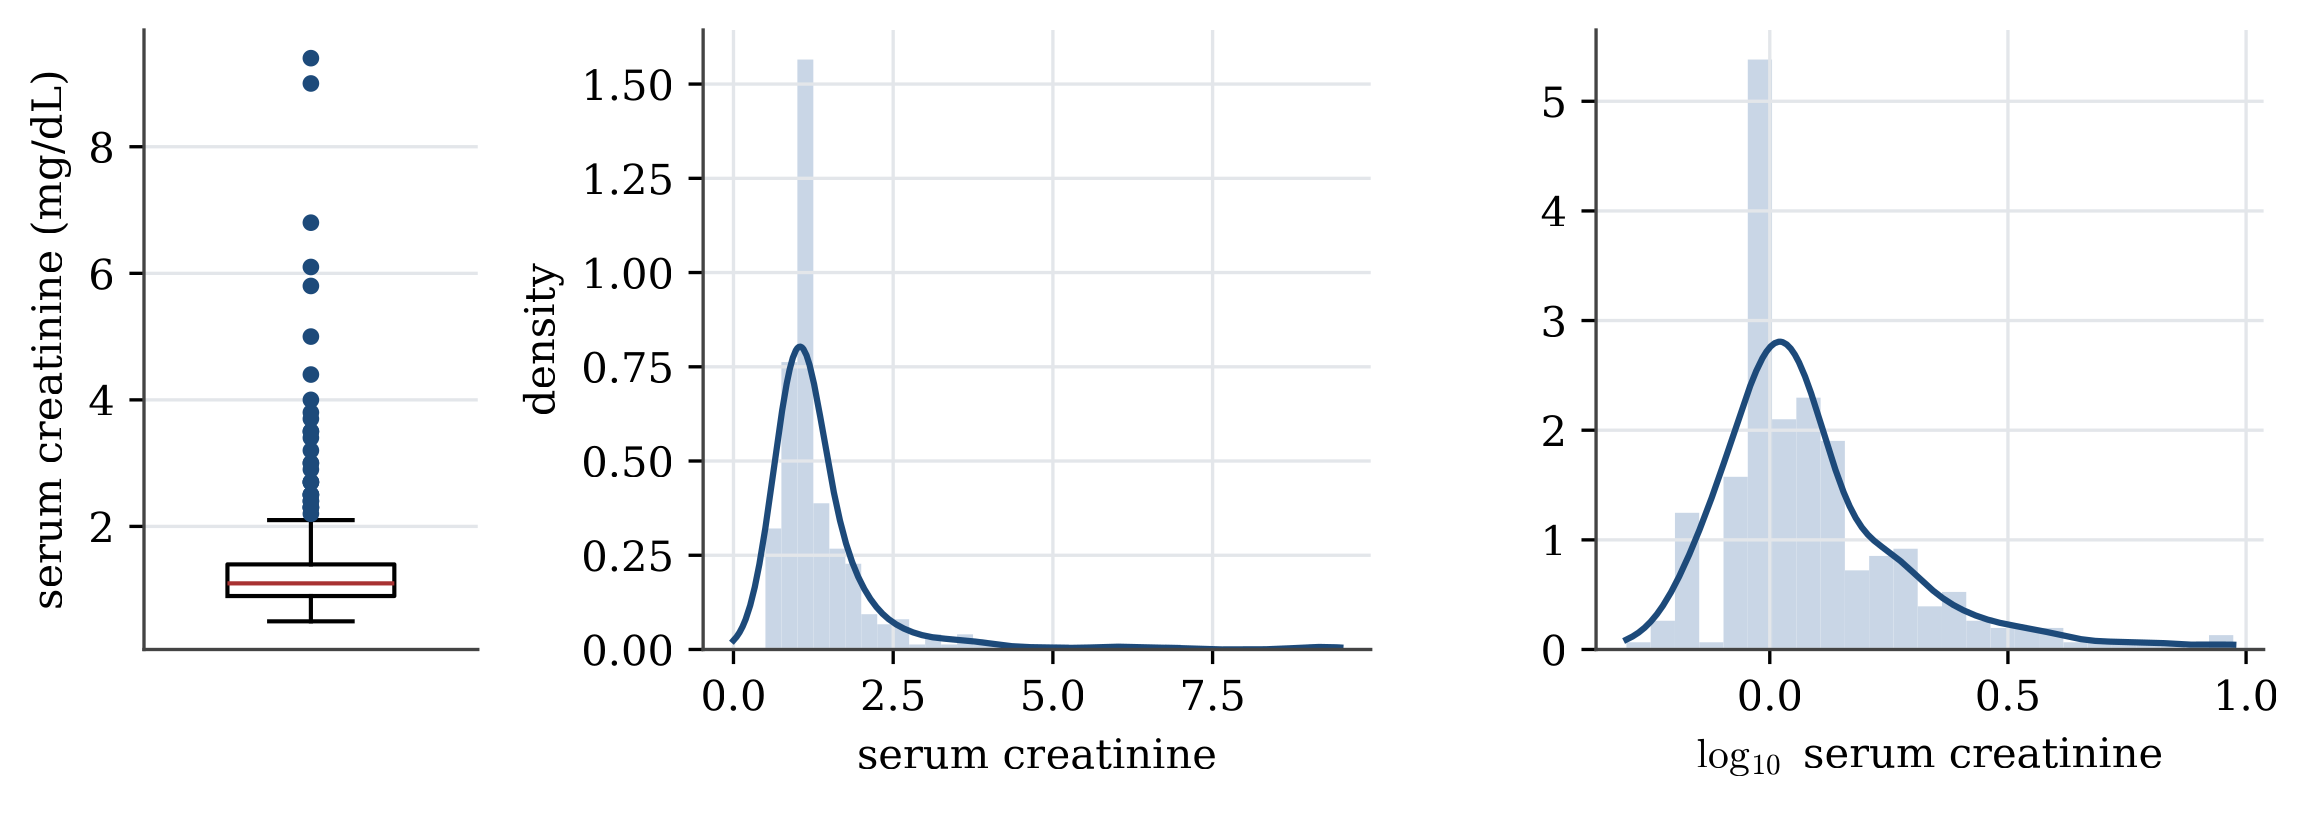
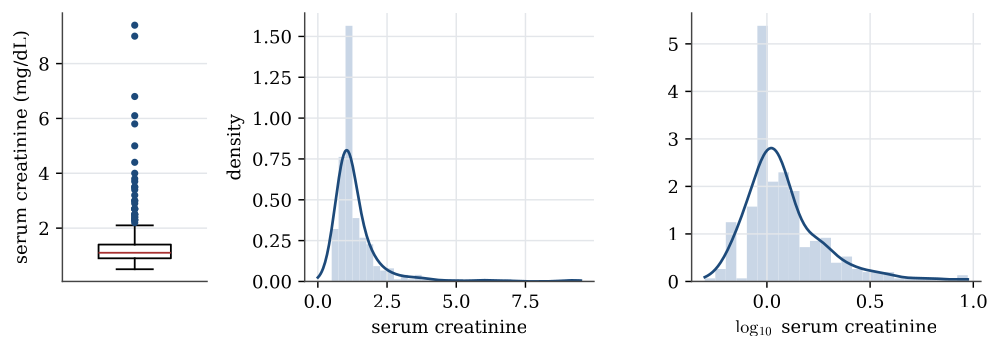
Description. Serum creatinine for the 299 patients. Left: a boxplot, with 29 points beyond the upper whisker. Middle: a histogram with a kernel density estimate. Right: the same data on a logarithmic scale, which pulls in the long right tail.
Appears in. Descriptive statistics
Made by. Drawn with Python and matplotlib from the example data. One script draws every figure in its section.
Download
- PNG, high resolution (2310 × 813 pixels, 99 KB)
- PNG, as shown on the wiki (1001 × 353 pixels, 41 KB)
- PDF, vector, prints at any size (20 KB)
- Python script (
stat1301-make_figures.py)
File usage
These 4 pages show the file: