File:inf-corn-groups.png
Figure file · Analysis of variance
Size of this preview: 810 × 383 pixels. Select it to open the high-resolution file.
Summary
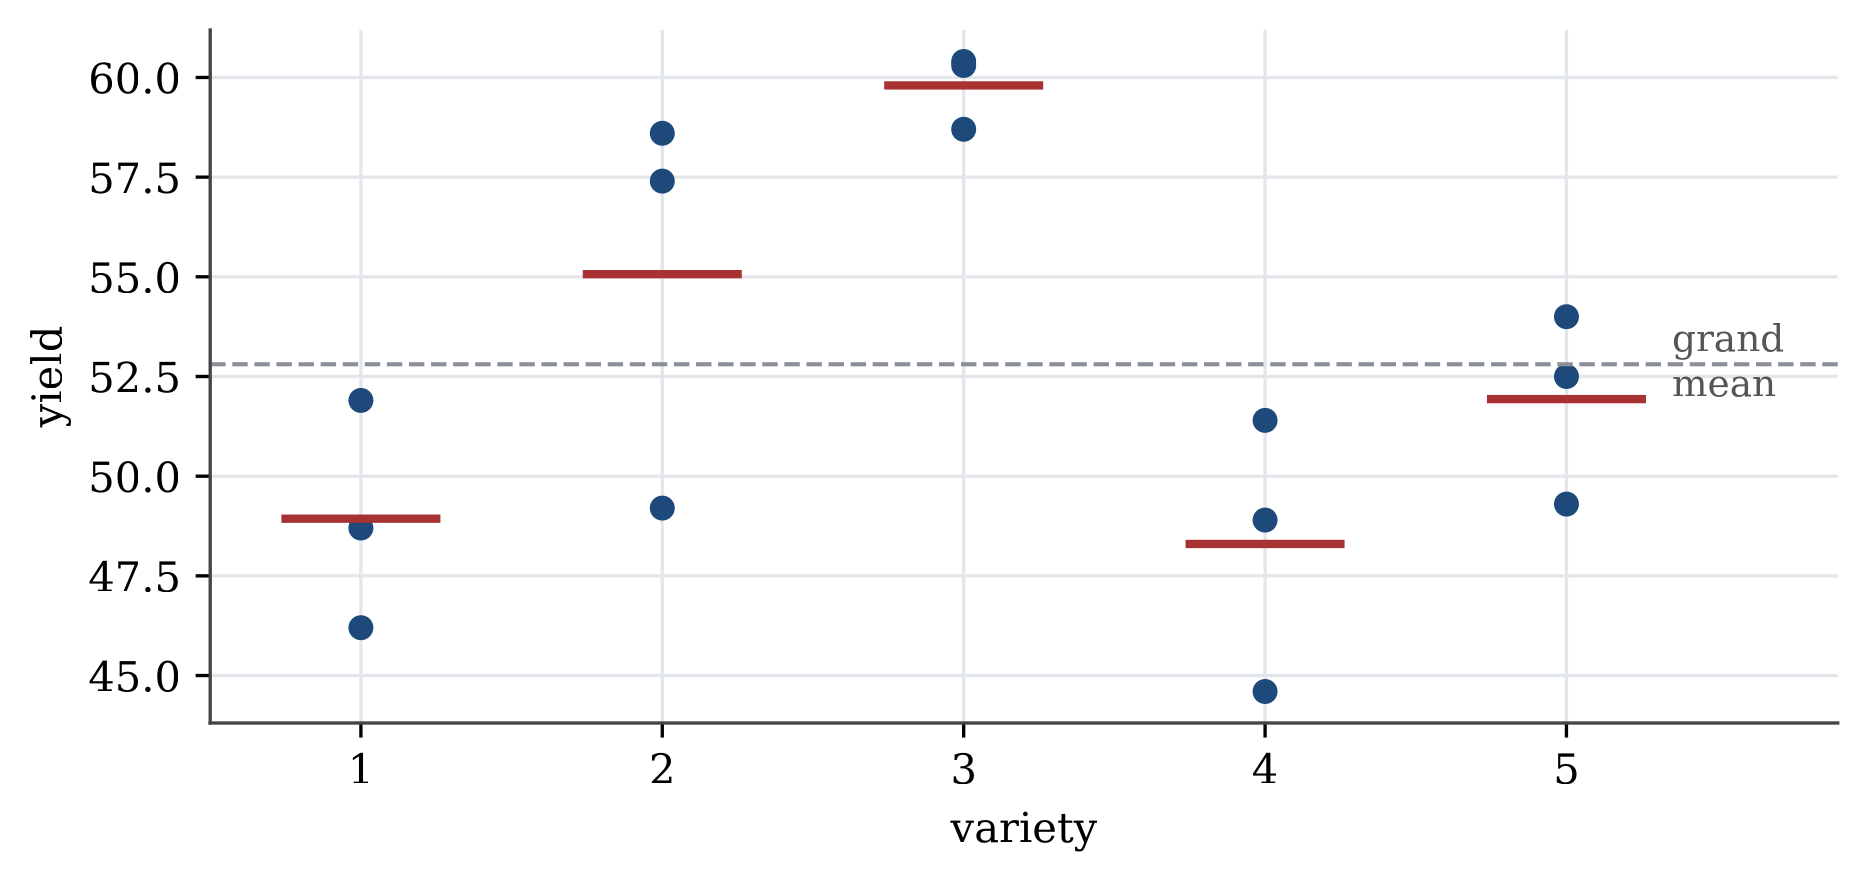
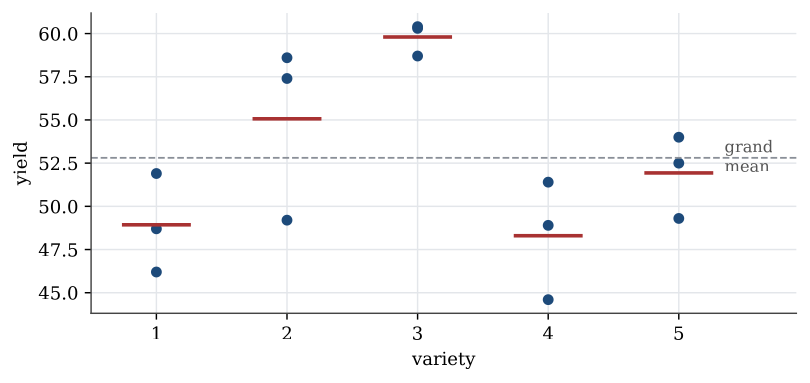
Description. Corn yields by variety, three plots each, with the variety means in red and the grand mean dashed. Variety 3 stands well above the others, and the scatter within each variety is smaller than the spread of the means.
Appears in. Analysis of variance
Made by. Drawn with Python and matplotlib from the example data. One script draws every figure in its section.
Download
- PNG, high resolution (1868 × 883 pixels, 51 KB)
- PNG, as shown on the wiki (810 × 383 pixels, 22 KB)
- PDF, vector, prints at any size (12 KB)
- Python script (
stat2004-make_figures.py)
File usage
These 3 pages show the file: