File:part1-fig-06-fruit-posterior.png
Figure file · Bayesian hypotheses and model comparison
Size of this preview: 604 × 338 pixels. Select it to open the high-resolution file.
Summary
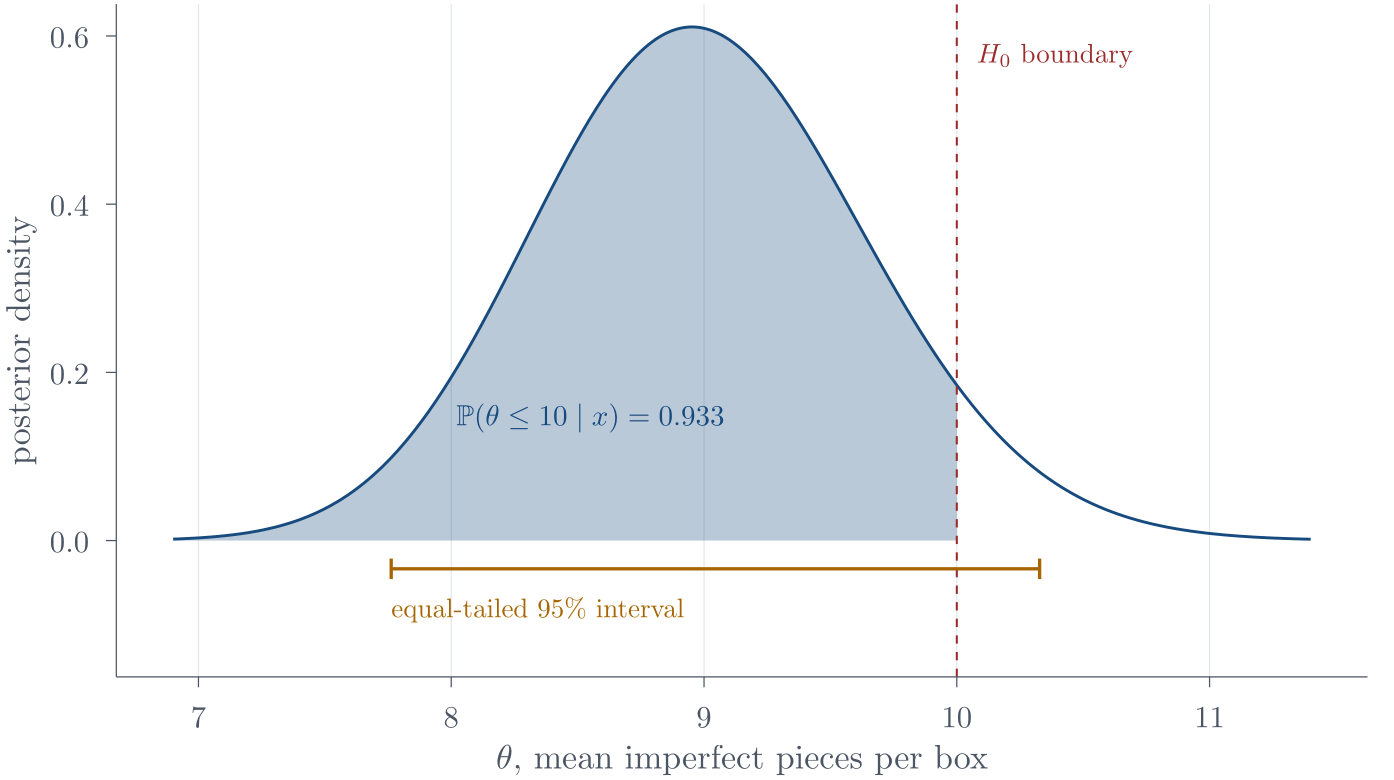
Description. The fruit posterior \operatorname{Gamma}(189,21), with the region \theta\leq10 shaded. The two summaries disagree in appearance only. The equal-tailed interval must leave 2.5\% in each tail, so its upper endpoint is pushed past 10; the shaded area answers a different question and puts 93.3\% of the mass at or below the boundary. Reading the crossing as a rejection substitutes one summary for the other.
Appears in. Bayesian hypotheses and model comparison
Made by. A figure from the course chapter.
Download
- PNG, high resolution (1394 × 780 pixels, 69 KB)
- PNG, as shown on the wiki (604 × 338 pixels, 23 KB)
- PDF, vector, prints at any size (57 KB)
File usage
These 4 pages show the file: