Prediction interval
Definition taught in Linear regression, part of Statistical inference
Prediction interval
| Type | Definition |
| Taught in | Linear regression |
| Part | Statistical inference |
| Properties | 1 |
| Worked examples | 3 |
| Questions using it | 2 |
For a new response Y\sim\operatorname{N}(\beta_0+\beta_1x,\sigma^2) independent of the sample, the interval
\widehat Y\pm t_{n-2;\,1-\alpha/2}\,S\sqrt{1+\frac1n+\frac{(x-\overline x)^2}{S_{xx}}}
contains Y with probability 1-\alpha.
Properties
Sampling distribution of the regression estimators
Main article: Sampling distribution of the regression estimators
Under simple linear regression,
\widehat\beta_1\sim\operatorname{N}\Bigl(\beta_1,\ \frac{\sigma^2}{S_{xx}}\Bigr), \qquad \widehat\beta_0\sim\operatorname{N}\Bigl(\beta_0,\ \frac{\sigma^2\sum_ix_i^2}{nS_{xx}}\Bigr),
and with S^2=\frac1{n-2}\sum(Y_i-\widehat\beta_0-\widehat\beta_1x_i)^2,
\frac{(n-2)S^2}{\sigma^2}\sim\chi^2_{n-2},
independently of (\widehat\beta_0,\widehat\beta_1). In particular S^2 is unbiased for \sigma^2. Moreover \widehat\beta_1 and \overline Y are independent.
Examples
Heart rate and oxygen intake
Worked example from Linear regression
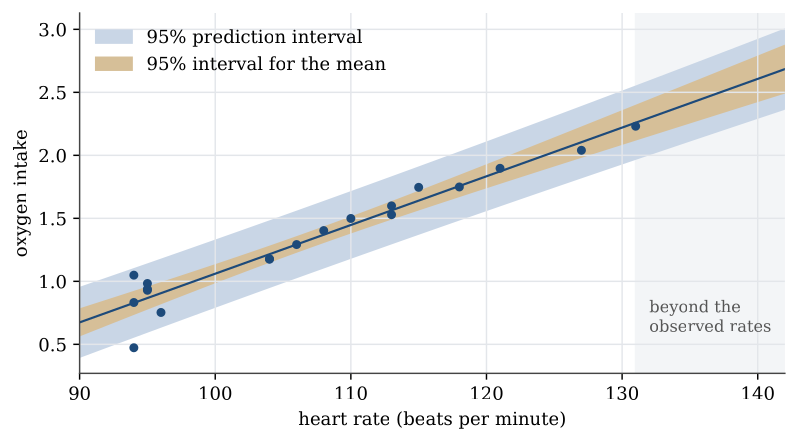
For one person, heart rate and oxygen intake are measured together 19 times.
| Heart rate | 94 | 96 | 95 | 95 | 94 | 95 | 94 | 104 | 104 | 106 |
|---|---|---|---|---|---|---|---|---|---|---|
| Oxygen | 0.473 | 0.753 | 0.929 | 0.939 | 0.832 | 0.983 | 1.049 | 1.178 | 1.176 | 1.292 |
| Heart rate | 108 | 110 | 113 | 113 | 118 | 115 | 121 | 127 | 131 |
|---|---|---|---|---|---|---|---|---|---|
| Oxygen | 1.403 | 1.499 | 1.529 | 1.599 | 1.749 | 1.746 | 1.897 | 2.040 | 2.231 |
Question. Fit the regression of oxygen intake on heart rate, give a 95% interval for the slope, and test whether the slope is zero.
Solution. Here \overline x=107.0 and S_{xx}=2518. The fitted line is y=-2.804+0.03865\,x. The residual standard deviation is S=0.1205, so S_1=0.1205/\sqrt{2518}=0.00240 and S_0=0.258. With t_{17;0.975}=2.110, the 95% interval for the slope is
0.03865\pm2.110\times0.00240=(0.0336,\ 0.0437).
It excludes zero. Equivalently, t=0.03865/0.00240=16.1, far beyond 2.110, so H_0:\beta_1=0 is rejected. Each extra beat per minute goes with about 0.039 more units of oxygen.
Predicting a student’s height
Worked example from Regression examples
Question. For a student with shoe size 30 cm, give a 95% interval for the mean height of such students, and a 95% interval for the height of one such student.
Solution.
predict(model1, data.frame(shoe = 30), interval = "confidence")
#        fit      lwr      upr
#   175.9217 173.4261 178.4172
predict(model1, data.frame(shoe = 30), interval = "prediction")
#        fit      lwr      upr
#   175.9217 157.2999 194.5434
The point prediction is 145.78+1.0048\times30=175.9 cm in both cases. The mean height of students with this shoe size is pinned down to within about 2.5 cm. A single student’s height is not: the prediction interval is (157.3,\ 194.5), about 37 cm wide, because a new student varies about the line with standard deviation near 9.3 cm whatever the sample size. The two intervals are the interval for the mean response and the prediction interval.
Where is the prediction interval narrowest?
Question page: Where is the prediction interval narrowest?
In simple linear regression, at which value of x is the prediction interval for a new response narrowest, and what is its half-width there? Does it shrink to zero as n\to\infty?
The half-width is t_{n-2;1-\alpha/2}\,S\sqrt{1+1/n+(x-\overline x)^2/S_{xx}}, which is smallest when (x-\overline x)^2=0, at x=\overline x. There it is t_{n-2;1-\alpha/2}\,S\sqrt{1+1/n}.
As n\to\infty, t_{n-2;1-\alpha/2}\to z_{1-\alpha/2}, S\to\sigma and 1/n\to0, so the half-width tends to z_{1-\alpha/2}\,\sigma, not to zero. However much data there is, a single new response still varies about the line with standard deviation \sigma.
Used in
- Taught in Linear regression, where the derivation and examples are.
- Also used in Regression examples
- Questions that use it (2) — Where is the prediction interval narrowest? · Rain, food, and orange yield
- All 5 questions on Linear regression
See also
Least-squares line · Least-squares estimators are unbiased · Simple linear regression · Sampling distribution of the regression estimators · Slope t pivot · Coefficient of determination