Sample correlation coefficient
Definition taught in Estimation, part of Statistical inference
Sample correlation coefficient
| Type | Definition |
| Taught in | Estimation |
| Part | Statistical inference |
| Worked examples | 3 |
| Questions using it | 2 |
For pairs (x_1,y_1),\ldots,(x_n,y_n), the sample correlation coefficient is
r=\frac{\sum_{i=1}^n(x_i-\overline x)(y_i-\overline y)}{\sqrt{\sum_{i=1}^n(x_i-\overline x)^2}\,\sqrt{\sum_{i=1}^n(y_i-\overline y)^2}}.
It lies in [-1,1], by the Cauchy–Schwarz inequality.
Examples
Testing a correlation
Worked example from Linear regression
Twenty pairs are generated by computer from a bivariate normal distribution with \mu_X=43, \mu_Y=4, \sigma_X^2=169, \sigma_Y^2=0.25 and \rho=0.4. The estimates from the sample are \widehat\mu_X=43.98, \widehat\mu_Y=3.92, \widehat\sigma_X^2=157.2, \widehat\sigma_Y^2=0.285 and R=0.438.
Question. Test H_0:\rho=0 against \rho\neq0 at level 0.05.
Solution. The statistic is 0.438\sqrt{18}/\sqrt{1-0.438^2}=2.06, against t_{18;0.975}=2.101. It falls just short, with two-sided p-value 0.054, so H_0 is not rejected at the 5% level, although the true correlation is 0.4. Twenty pairs give little power against a moderate correlation. Failing to reject is not evidence that \rho=0.
The correlation test is the slope test
Question page: The correlation test is the slope test
Show that \widehat\beta_1/S_1=R\sqrt{n-2}/\sqrt{1-R^2}, where R is the sample correlation. Use R^2=\widehat\beta_1^2S_{xx}/S_{YY} and (n-2)S^2=S_{YY}(1-R^2).
Start from \widehat\beta_1/S_1=\widehat\beta_1\sqrt{S_{xx}}/S. Square it and use the two identities:
\frac{\widehat\beta_1^2S_{xx}}{S^2}=\frac{R^2S_{YY}}{S_{YY}(1-R^2)/(n-2)}=\frac{(n-2)R^2}{1-R^2}.
\widehat\beta_1 and R have the same sign, both being S_{xY} divided by something positive. Taking square roots, \widehat\beta_1/S_1=R\sqrt{n-2}/\sqrt{1-R^2}. Testing \beta_1=0 in the fixed-x model and testing \rho=0 in the bivariate normal model use the same statistic and the same t_{n-2} reference distribution.
Reading a correlation
Question page: Reading a correlation
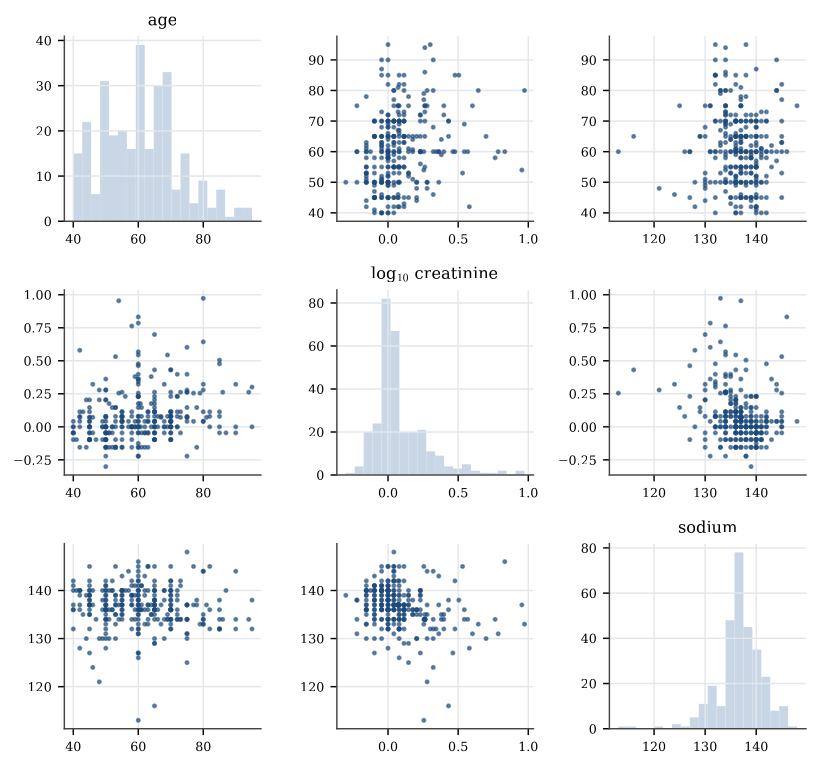
The sample correlation between \log_{10} serum creatinine and serum sodium in a heart-failure cohort is -0.26, and the correlation between \log_{10} serum creatinine and age is 0.23.
Which pair moves together, and which pair moves in opposite directions?
Why is neither correlation, by itself, a reason to conclude that one variable causes the other?
Serum creatinine and age move together: the correlation 0.23 is positive, so older patients tend to have somewhat higher creatinine. Creatinine and sodium move in opposite directions: the correlation -0.26 is negative. Both are weak; a correlation of about \pm0.25 means a straight line accounts for only about 6% of the variance of either variable.
A correlation measures linear association in this sample only. It can arise because a third variable drives both, here perhaps overall illness or kidney function, because the causal arrow points the other way, or by chance. These are observational data, so nothing was assigned and no causal reading follows from the correlation alone.
Figures
Used in
- Taught in Estimation, where the derivation and examples are.
- Also used in Linear regression
- Questions that use it (2) — The correlation test is the slope test · Reading a correlation
- All 5 questions on Estimation
See also
Estimator · Method of moments · Likelihood function · Maximum likelihood · Invariance of maximum likelihood · Unbiased estimator · Mean squared error · Consistent estimator