File:inf-04-hypothesis-tests-errors.png
Figure file · Hypothesis tests
Size of this preview: 839 × 364 pixels. Select it to open the high-resolution file.
Summary
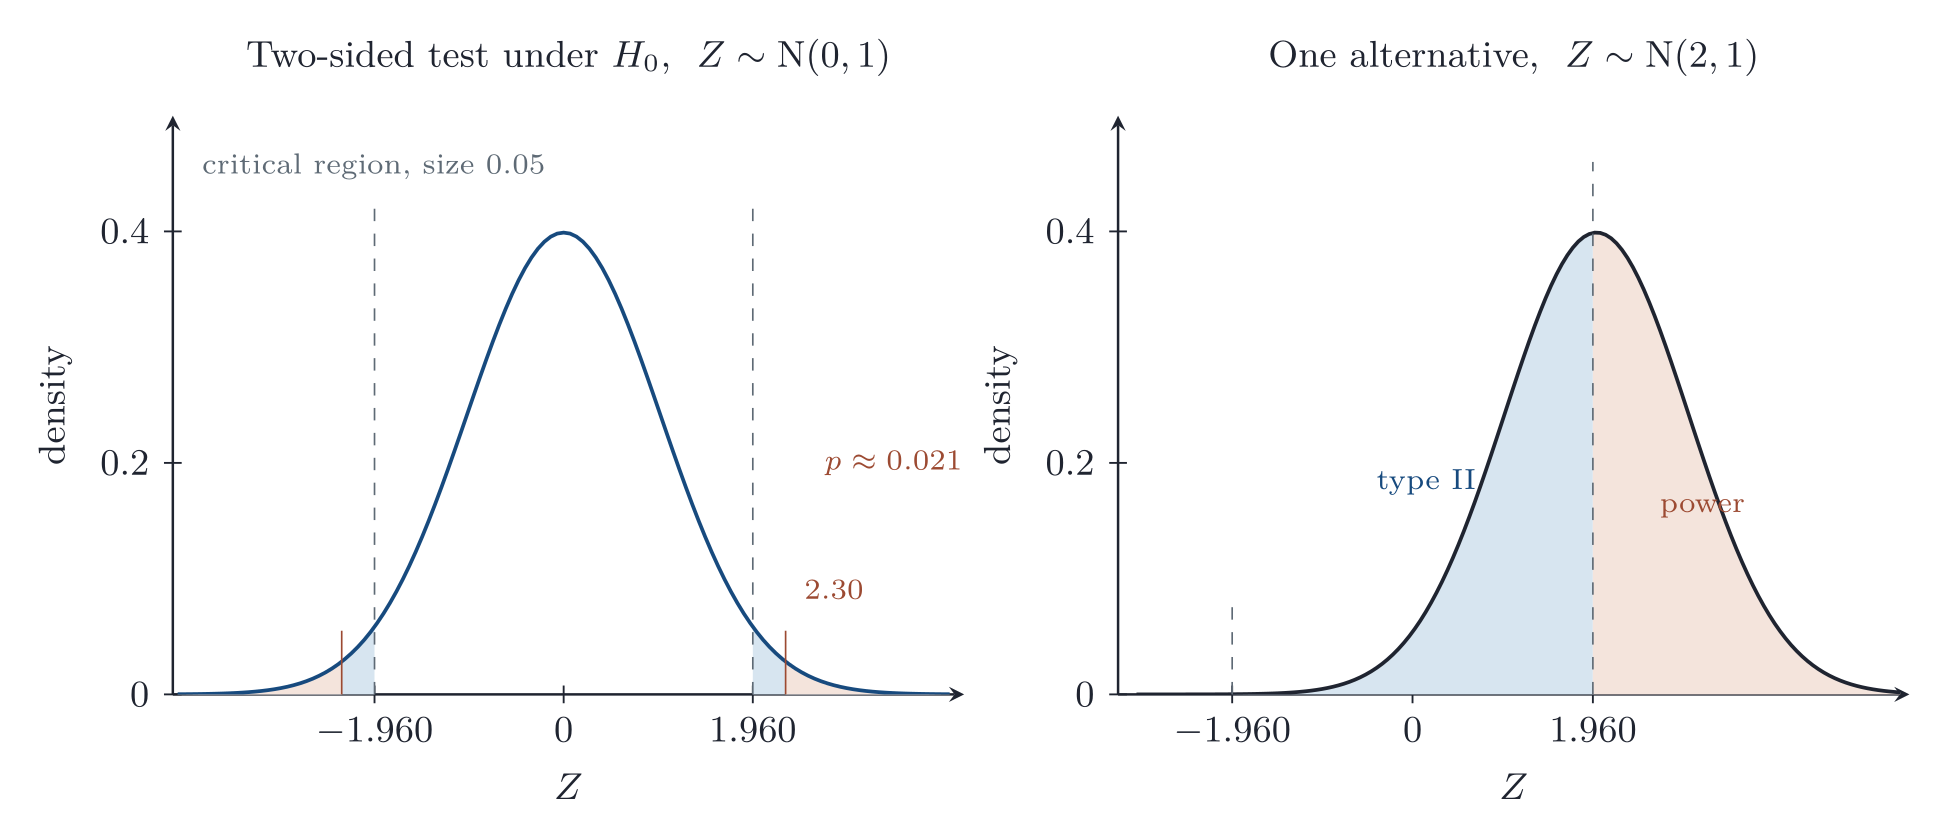
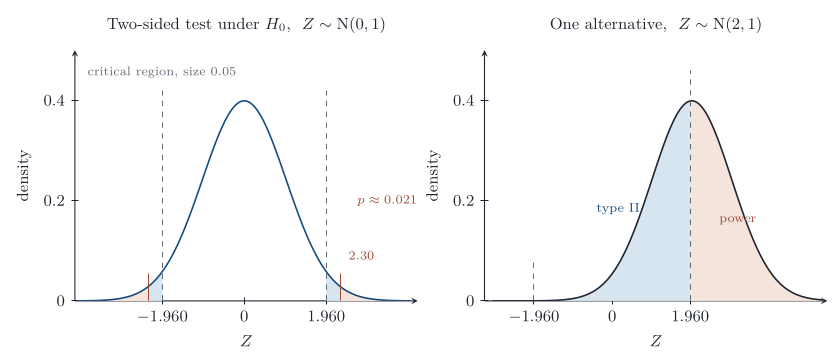
Description. Left: a two-sided z test of size 0.05. Under H_0 the statistic is \operatorname{N}(0,1), the critical region is the two tails beyond \pm1.960, and an observed z=2.30 has p-value 0.021. Right: under the alternative Z\sim\operatorname{N}(2,1) the same cutoffs split the density into the power, the part beyond them, and the type II error, the part between.
Appears in. Hypothesis tests
Made by. Drawn in TikZ. The source is a standalone LaTeX file.
Download
- PNG, high resolution (1936 × 838 pixels, 105 KB)
- PNG, as shown on the wiki (839 × 364 pixels, 37 KB)
- PDF, vector, prints at any size (90 KB)
- TikZ source (
inf-04-hypothesis-tests-errors.tex)
File usage
These 4 pages show the file: