Power function
Definition taught in Hypothesis tests, part of Statistical inference
Power function
| Type | Definition |
| Taught in | Hypothesis tests |
| Part | Statistical inference |
| Worked examples | 3 |
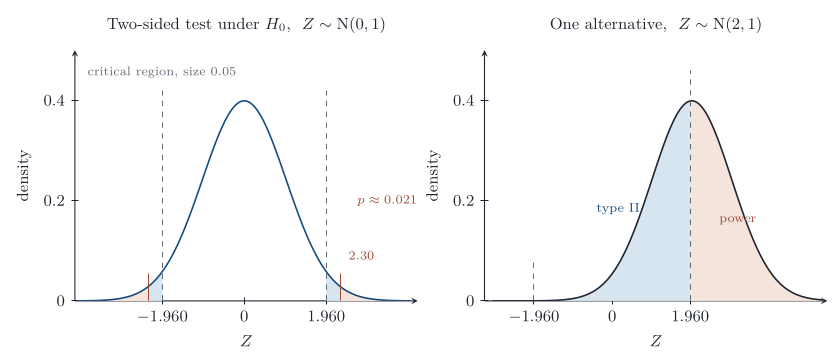
For a test with critical region C, the power at \theta is \operatorname{Power}(\theta)=\mathbb{P}_\theta(T\in C). On \Theta_1 it equals one minus the type II error at \theta, and on \Theta_0 it is the type I error. Its graph is the power curve.
Examples
Simulating the power of a t test
Worked example from Testing examples
A one-sample t test of H_0:\mu=0 against H_1:\mu>0 is run at level 0.05 on n observations.
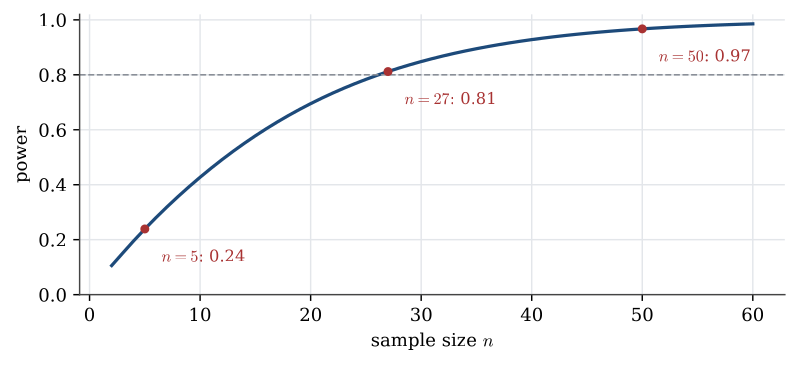
Question. What is its power if the data are really \operatorname{N}(1,2^2), with n=5 and with n=50?
Solution.
R <- 1e5; n <- 5; mu <- 1; sigma <- 2
pval <- replicate(R, {
  x <- rnorm(n, mean = mu, sd = sigma)
  1 - pt(mean(x) / (sd(x) / sqrt(n)), df = n - 1)
})
mean(pval < 0.05)                      # about 0.24
power.t.test(n = 5, delta = 1, sd = 2, sig.level = 0.05,
             type = "one.sample", alternative = "one.sided")$power   # 0.239
With five observations the test detects a mean of 1 only 24% of the time. With n=50 the power is 0.967. The power depends on \mu and \sigma only through their ratio \mu/\sigma, here 1/2, together with n and the level. A power calculation of this kind, using a guess at \sigma from a pilot study, is how a sample size is chosen before the data are collected.
Power of a serve test
Question page: Power of a serve test
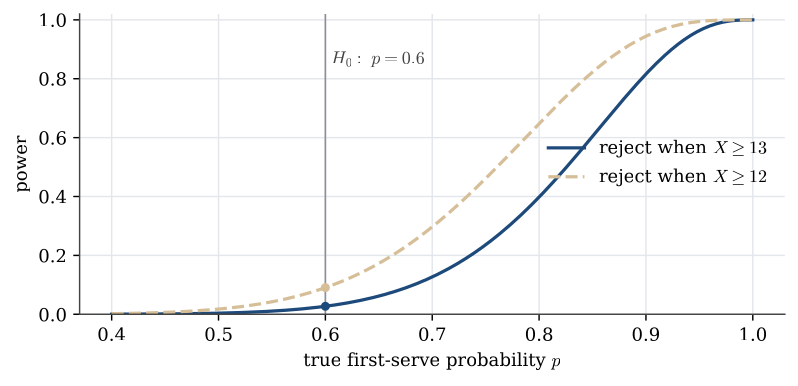
A player’s first-serve successes are modelled as X\sim\operatorname{Bin}(15,p). The test of H_0:p=0.6 against H_1:p>0.6 rejects when X\in\{13,14,15\}.
Compute the size of the test, that is the power at p=0.6.
Write the power as a function of p, and evaluate it at p=0.9.
Under H_0, X\sim\operatorname{Bin}(15,0.6) and
\mathbb{P}(X\ge 13)=\sum_{k=13}^{15}\binom{15}{k}(0.6)^k(0.4)^{15-k}\approx 0.0271.
That is the size of the test. At a general p,
\mathrm{Power}(p)=\sum_{k=13}^{15}\binom{15}{k}p^k(1-p)^{15-k}.
At p=0.9 the power is about 0.816. At p=0.8 it is only 0.398: with 15 serves, a real improvement from 60% to 80% would be missed more often than not.
How small a variance?
Question page: How small a variance?
In the tuning-fork example, 7 forks are tested, H_0:\sigma^2=1.1 and H_1:\sigma^2<1.1, at level 0.05. Using \chi^2_{6;0.05}=1.635, find the largest sample variance that leads to rejection. What is the power of this test if the true variance is 0.3?
The test rejects when 6s^2/1.1\le1.635, that is when s^2\le1.635\times1.1/6=0.300.
If the true variance is 0.3, then 6s^2/0.3\sim\chi^2_6, and the power is
\mathbb{P}(s^2\le0.300)=\mathbb{P}\Bigl(\frac{6s^2}{0.3}\le\frac{6\times0.300}{0.3}\Bigr)=\mathbb{P}(\chi^2_6\le5.995)\approx0.58.
Even a reduction of the variance to less than a third of its old value is detected only a little more than half the time with 7 forks.
Figures
Used in
- Taught in Hypothesis tests, where the derivation and examples are.
- All 6 questions on Hypothesis tests
See also
Critical region · Type I and type II errors · Null and alternative hypotheses · p-value · Neyman–Pearson approach · One-sample t test · Two-sample t test · F test for equal variances