Neyman–Pearson approach
Definition taught in Hypothesis tests, part of Statistical inference
Neyman–Pearson approach
| Type | Definition |
| Taught in | Hypothesis tests |
| Part | Statistical inference |
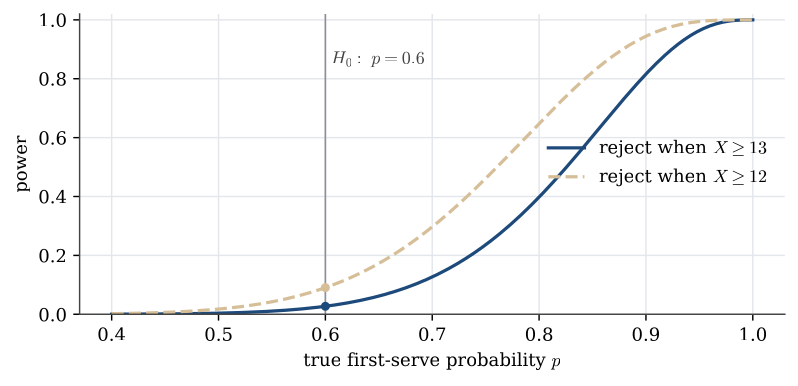
Fix a significance level \alpha. Among critical regions whose type I error is at most \alpha, choose one whose type II error is as small as possible.
Used in
- Taught in Hypothesis tests, where the derivation and examples are.
- All 6 questions on Hypothesis tests
See also
Critical region · Type I and type II errors · Null and alternative hypotheses · p-value · Power function · One-sample t test · Two-sample t test · F test for equal variances