p-value
Definition taught in Hypothesis tests, part of Statistical inference
p-value
| Type | Definition |
| Taught in | Hypothesis tests |
| Part | Statistical inference |
| Worked examples | 2 |
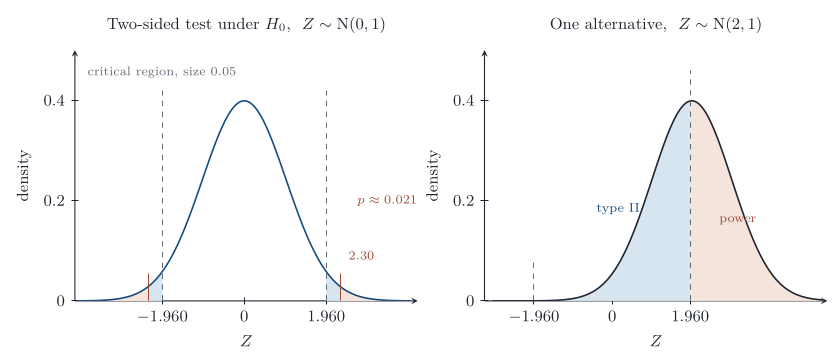
The p-value of an observed statistic t is the probability, under H_0, that T is at least as extreme as t, in the direction of H_1. For a two-sided normal or t statistic it is twice the one-sided tail probability beyond |t|.
Examples
A gene in lake fish
Worked example from Hypothesis tests
A gene occurs in 15% of a fish population. In a sample of 100 fish from one lake, 10 carry it.
Question. Is there evidence that the lake population differs?
Solution. (1) Let X be the number of carriers among 100, X\sim\operatorname{Bin}(100,p). (2) H_0:p=0.15 against H_1:p\neq0.15; the alternative is the claim that the lake is different. (3) The statistic is X. (4) Under H_0, X\sim\operatorname{Bin}(100,0.15). (5) x=10. (6) The two-sided p-value is 2\mathbb{P}_{H_0}(X\le10)=2\times0.0994=0.199. The normal approximation \operatorname{N}(15,12.75) gives 2\Phi\{(10-15)/\sqrt{12.75}\}=2\Phi(-1.40)=0.161, and with the continuity correction, 2\Phi\{(10.5-15)/\sqrt{12.75}\}=0.208, close to the exact value. (7) The p-value is large, so H_0 is not rejected. (8) There is no evidence that the proportion of carriers in the lake differs from 15%.
Caffeine in cola
Worked example from Hypothesis tests
A claim is that regular cola contains 19 mg of caffeine per serving. For n=40 servings of another brand, \overline x=19.57 mg and s=1.40 mg.
Question. At level 0.01, is the mean caffeine content of this brand more than 19 mg?
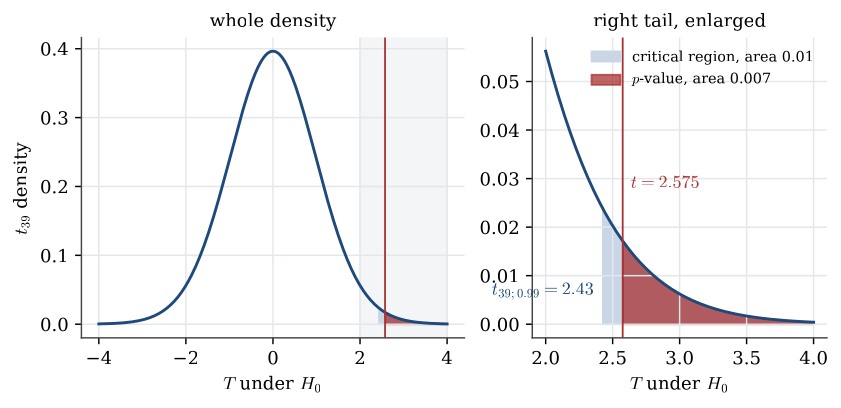
Solution. Model the servings as a normal random sample. Test H_0:\mu=19 against H_1:\mu>19. The statistic is
t=\frac{19.57-19}{1.40/\sqrt{40}}=2.575,
against t_{39}. The critical value is t_{39;0.99}=2.43, so t is in the critical region, and the p-value is 0.007. Reject H_0: there is strong evidence that the mean exceeds 19 mg.
Statistical significance is not practical significance. The one-sided 99% lower confidence bound is 19.57-2.43\times1.40/\sqrt{40}=19.03, so the data are consistent with a mean barely above 19. The two-sided 99% interval, (18.97,\ 20.17), even includes 19, because it spends only half its error on each side. Whether a mean of 19.5 or 20 mg matters for health is a question the test cannot answer.
Figures
Used in
- Taught in Hypothesis tests, where the derivation and examples are.
- All 6 questions on Hypothesis tests
See also
Null and alternative hypotheses · Critical region · Type I and type II errors · Neyman–Pearson approach · Power function · One-sample t test · Two-sample t test · F test for equal variances