File:inf-power-curve.png
Figure file · Hypothesis tests
Size of this preview: 798 × 386 pixels. Select it to open the high-resolution file.
Summary
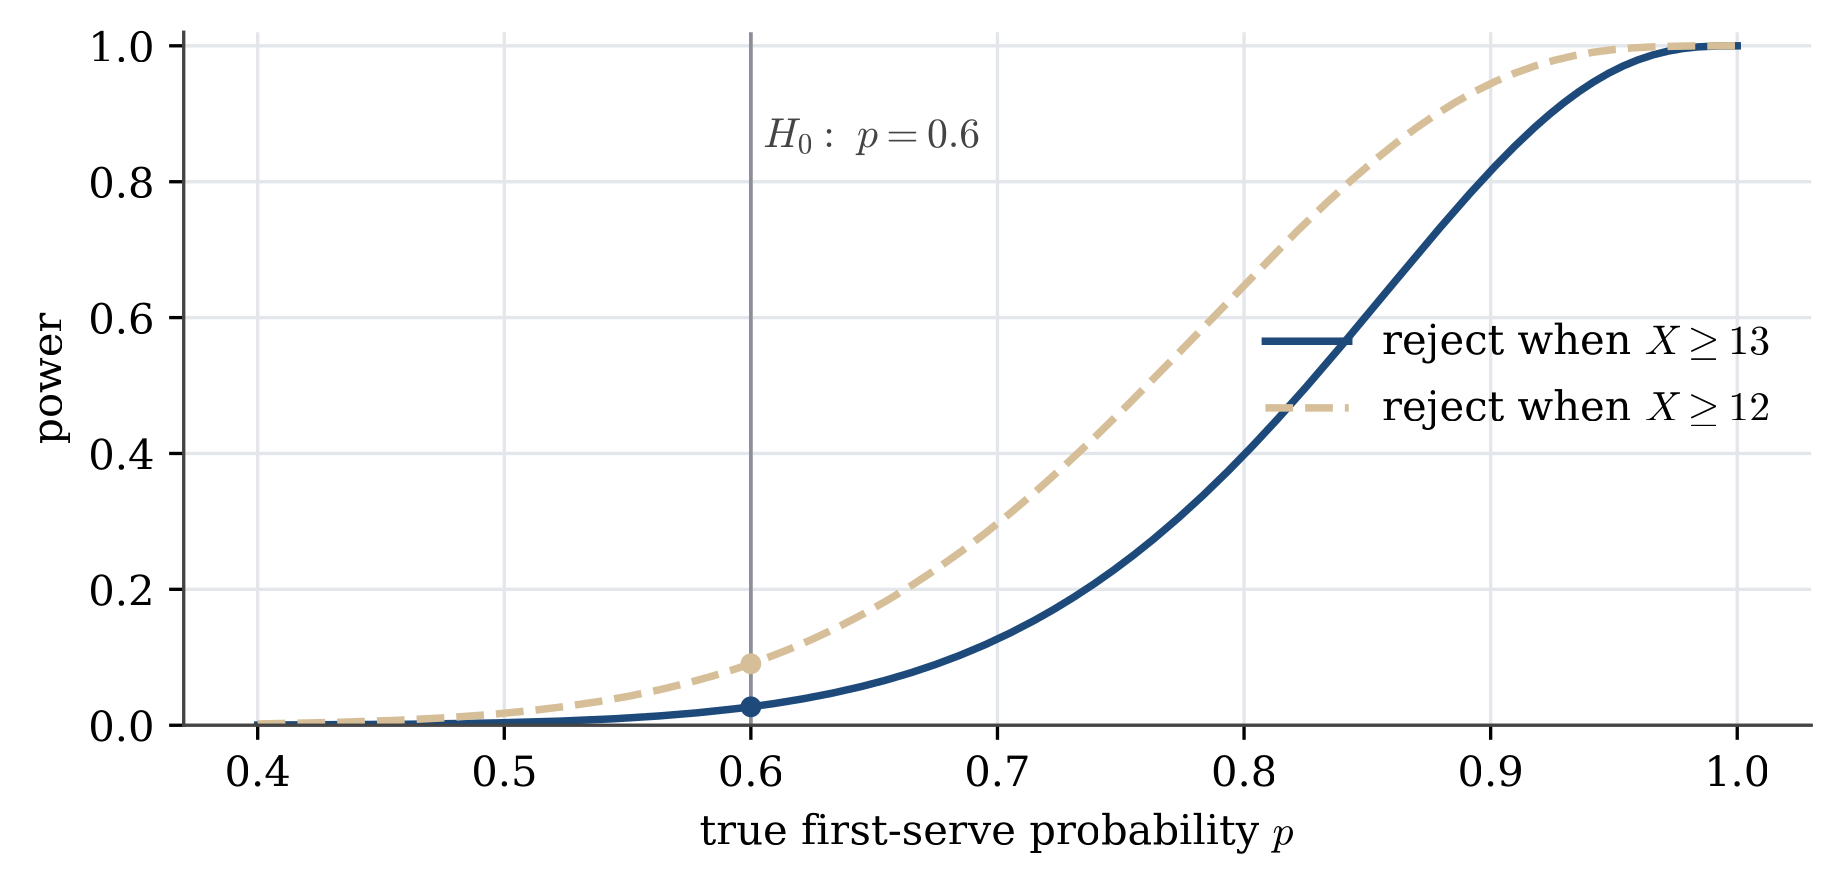
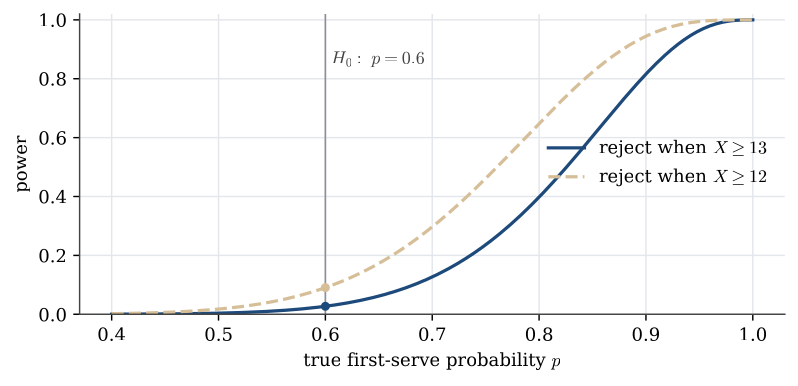
Description. Power curves for two tests of H_0:p=0.6 against p>0.6 from 15 serves. Rejecting at 13 or more keeps the size at 0.027, but has power only 0.40 even at p=0.8. Rejecting at 12 or more gains power everywhere, and its size rises to 0.091, above the 5% level.
Appears in. Hypothesis tests
Made by. Drawn with Python and matplotlib from the example data. One script draws every figure in its section.
Download
- PNG, high resolution (1842 × 889 pixels, 95 KB)
- PNG, as shown on the wiki (798 × 386 pixels, 38 KB)
- PDF, vector, prints at any size (24 KB)
- Python script (
stat2004-make_figures.py)
File usage
These 4 pages show the file: