File:inf-regression-effect.png
Figure file · Linear regression
Size of this preview: 810 × 463 pixels. Select it to open the high-resolution file.
Summary
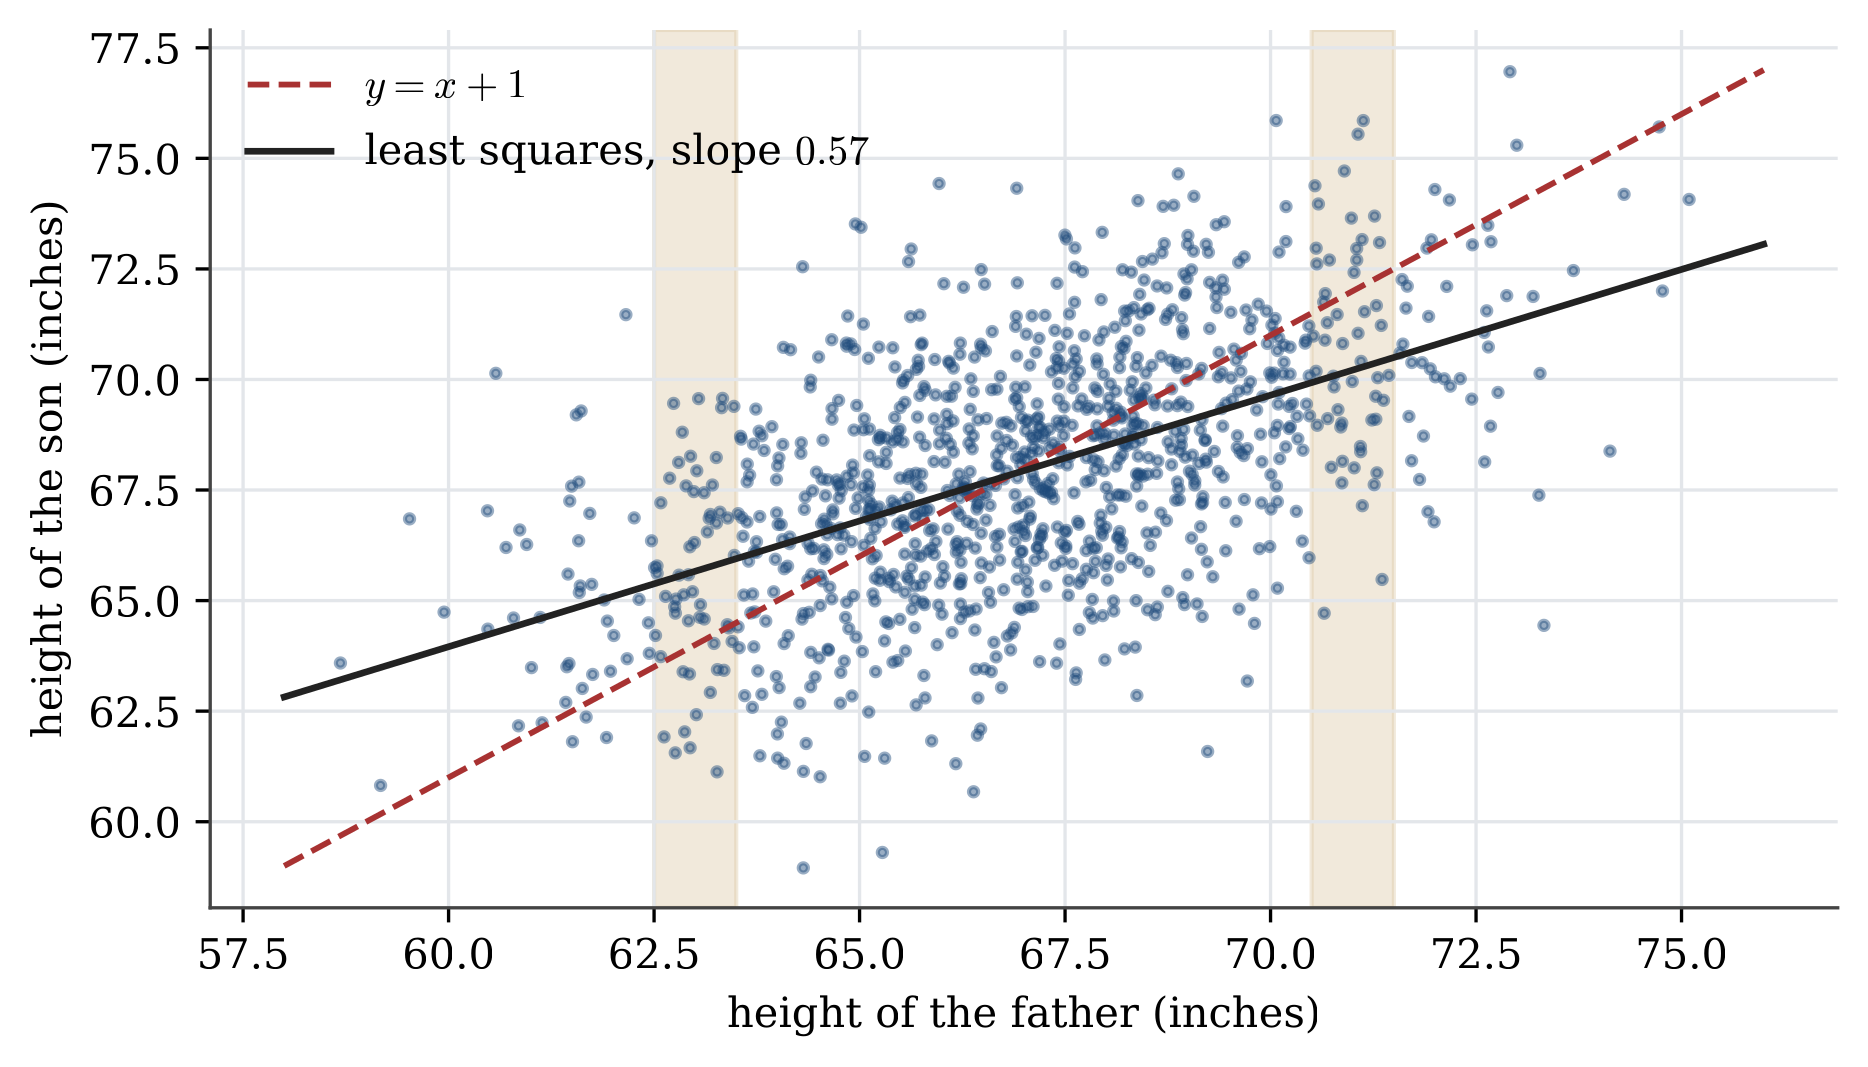
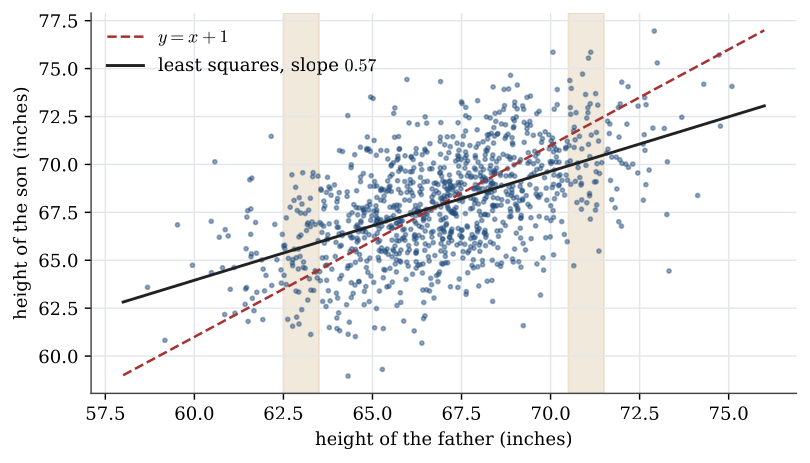
Description. A simulated sample of 1078 father–son pairs, with means 67 and 68 inches, both standard deviations 2.7 inches and correlation 0.5. In the shaded strip at 63 inches most sons are above the dashed line y=x+1; at 71 inches most are below it. The least-squares line has slope near the correlation, well below 1.
Appears in. Linear regression
Made by. Drawn with Python and matplotlib from the example data. One script draws every figure in its section.
Download
- PNG, high resolution (1868 × 1067 pixels, 441 KB)
- PNG, as shown on the wiki (810 × 463 pixels, 132 KB)
- PDF, vector, prints at any size (37 KB)
- Python script (
stat2004-make_figures.py)
File usage
These 3 pages show the file: