File:inf-t-densities.png
Figure file · Confidence intervals
Size of this preview: 798 × 403 pixels. Select it to open the high-resolution file.
Summary
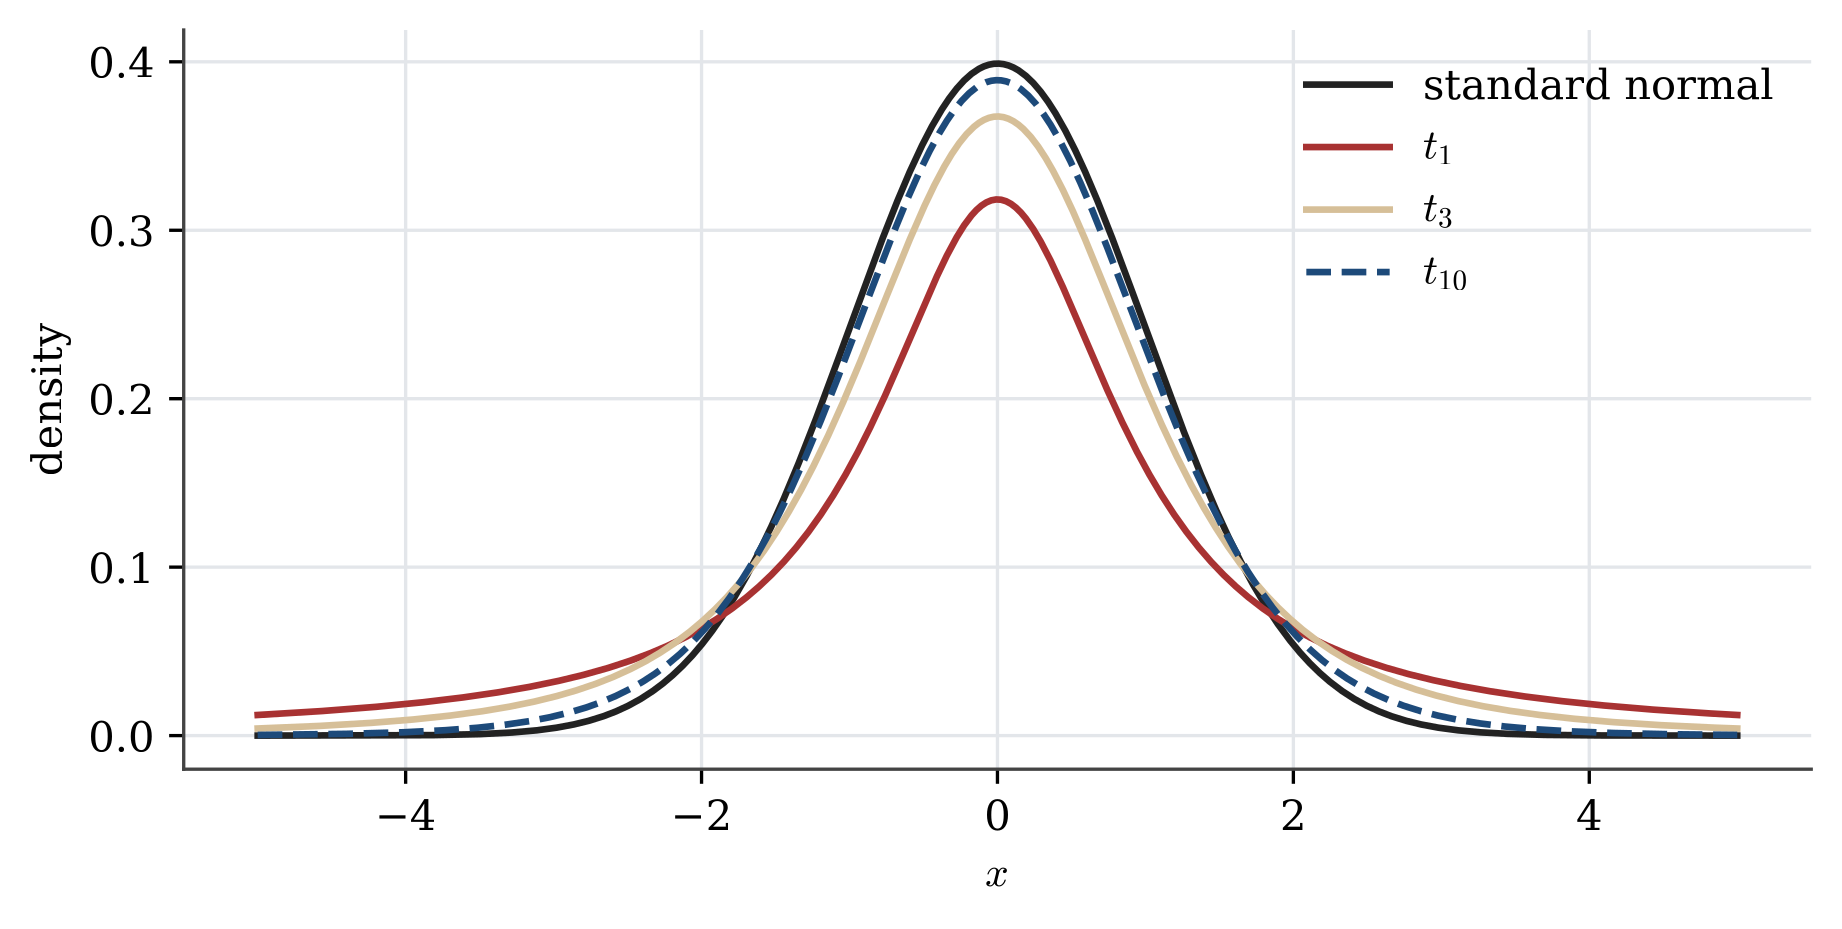
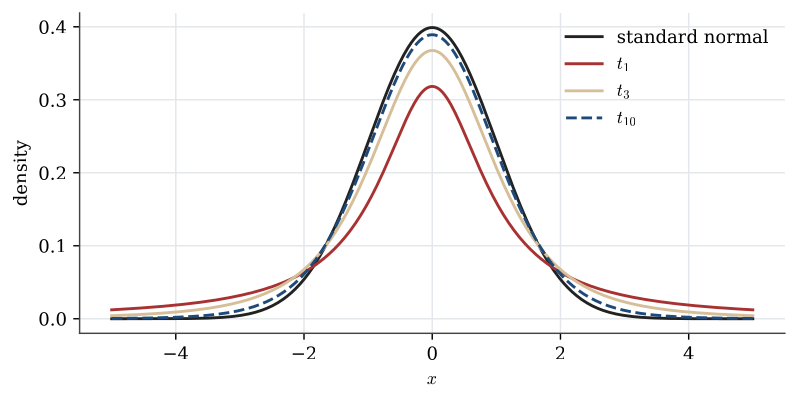
Description. The Student t density with 1, 3 and 10 degrees of freedom, against the standard normal. Fewer degrees of freedom mean heavier tails, and therefore larger quantiles and wider intervals. By 10 degrees of freedom the curve is already close to normal.
Appears in. Confidence intervals
Made by. Drawn with Python and matplotlib from the example data. One script draws every figure in its section.
Download
- PNG, high resolution (1842 × 929 pixels, 121 KB)
- PNG, as shown on the wiki (798 × 403 pixels, 47 KB)
- PDF, vector, prints at any size (19 KB)
- Python script (
stat2004-make_figures.py)
File usage
These 3 pages show the file: