File:part1-fig-02-prior-sensitivity.png
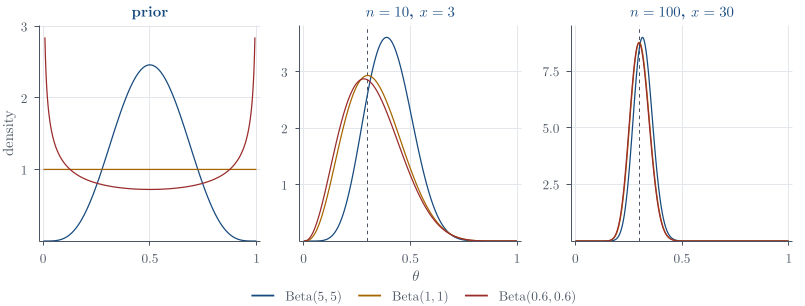
Size of this preview: 805 × 306 pixels. Select it to open the high-resolution file.
Summary
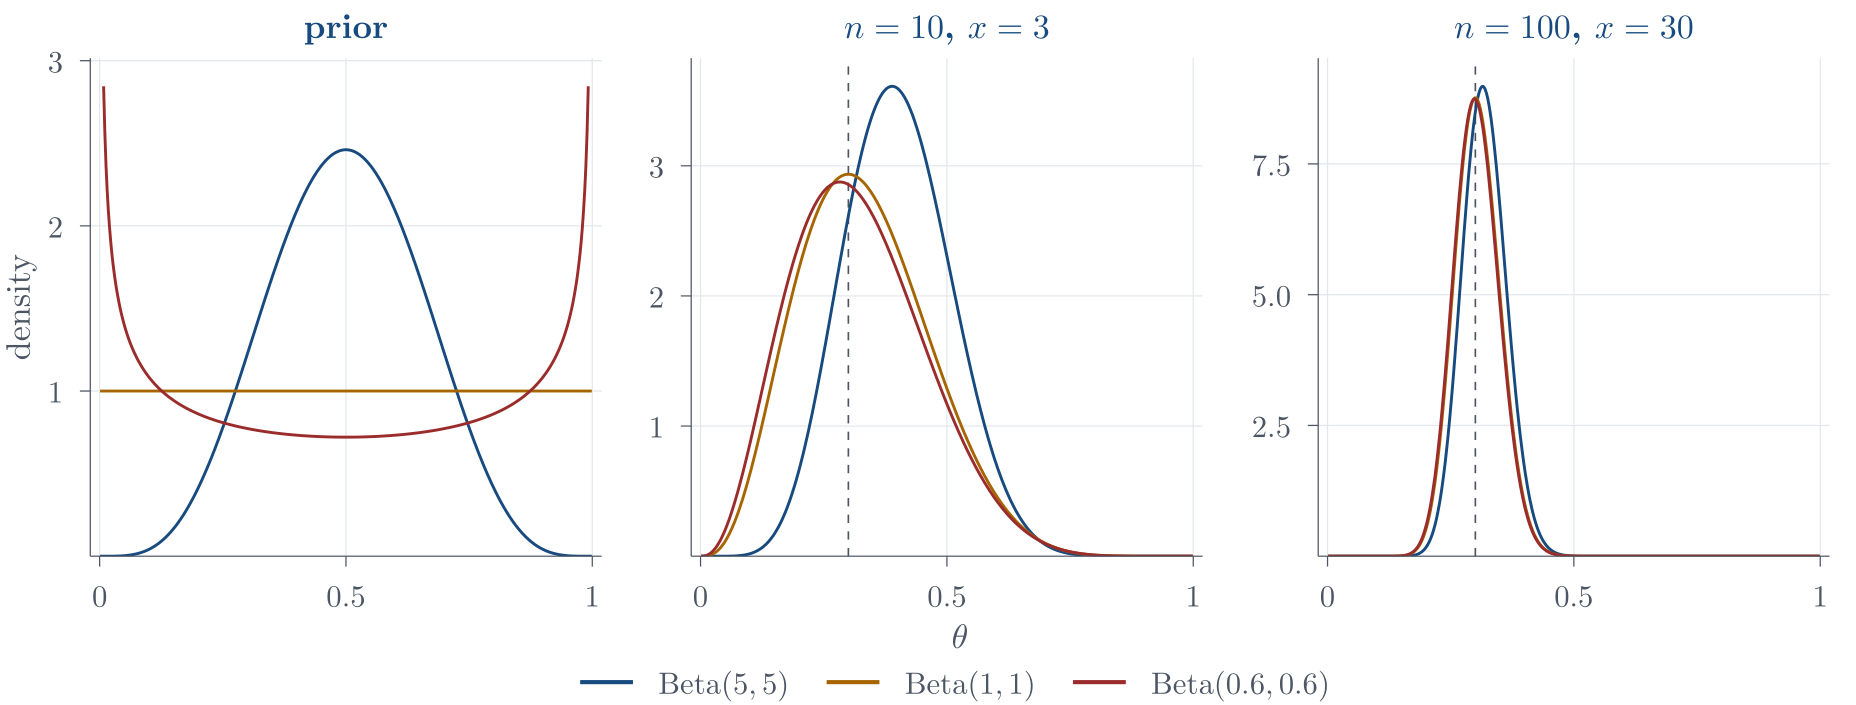
Description. The three priors, then the posteriors they produce after 3 heads in 10 tosses and after 30 heads in 100. Both datasets have the same observed proportion 0.3, marked by the dashed vertical line, so moving to the right changes only how much weight the data carry. Ten tosses leave three visibly different posteriors; one hundred leave three that have nearly closed on each other and on x/n. Disagreement about the prior is a disagreement about small samples. The \operatorname{Beta}(0.6,0.6) prior is unbounded at 0 and 1, so its curve leaves the top of the first panel.
Appears in. The Beta–Binomial model
Made by. A figure from the course chapter.
Download
- PNG, high resolution (1856 × 705 pixels, 114 KB)
- PNG, as shown on the wiki (805 × 306 pixels, 40 KB)
- PDF, vector, prints at any size (57 KB)
File usage
These 3 pages show the file: