File:part1-fig-08-hyperposterior-grid.png
Figure file · Hierarchical Bayes
Size of this preview: 598 × 423 pixels. Select it to open the high-resolution file.
Summary
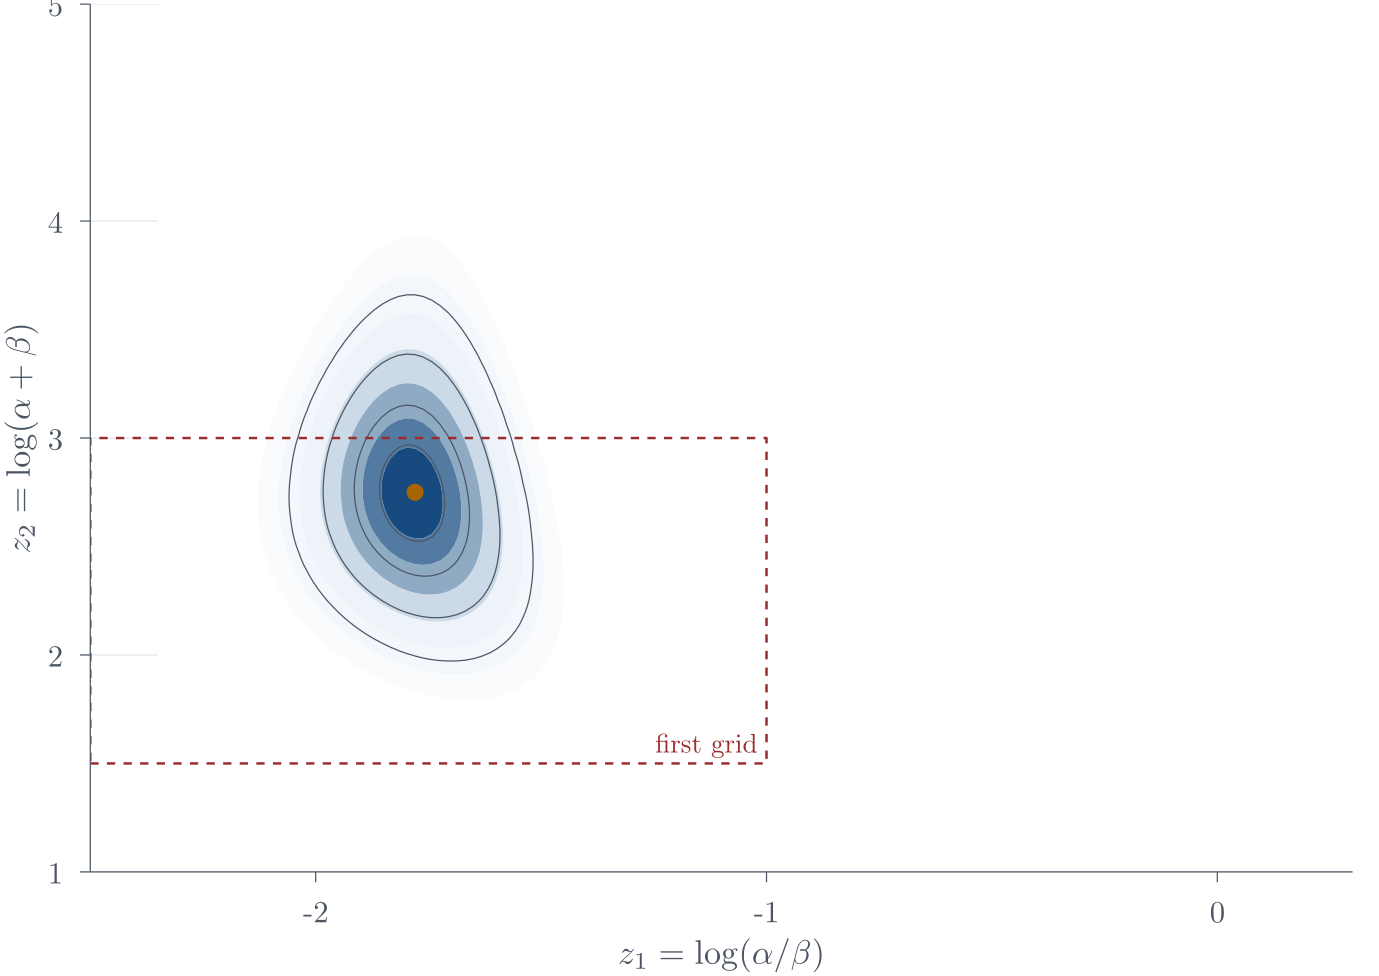
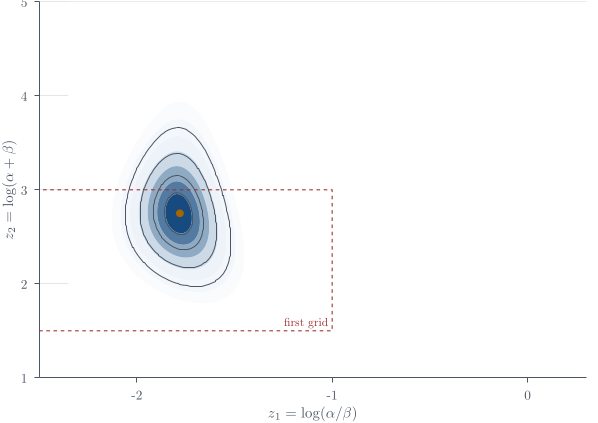
Description. Contours of the rat-tumour hyperposterior in the transformed (z_1,z_2) coordinates, including the Jacobian \alpha\beta. The dashed outline marks a grid whose boundary cuts through the density. Its upper edge cuts through appreciable density, so enlarging the numerical domain is part of the calculation rather than a plotting preference. The gold point is the largest evaluated grid value on the expanded domain.
Appears in. Hierarchical Bayes
Made by. A figure from the course chapter.
Download
- PNG, high resolution (1379 × 976 pixels, 74 KB)
- PNG, as shown on the wiki (598 × 423 pixels, 27 KB)
- PDF, vector, prints at any size (49 KB)
File usage
These 4 pages show the file: