File:prob-inverse-transform.png
Figure file · Simulation
Size of this preview: 754 × 387 pixels. Select it to open the high-resolution file.
Summary
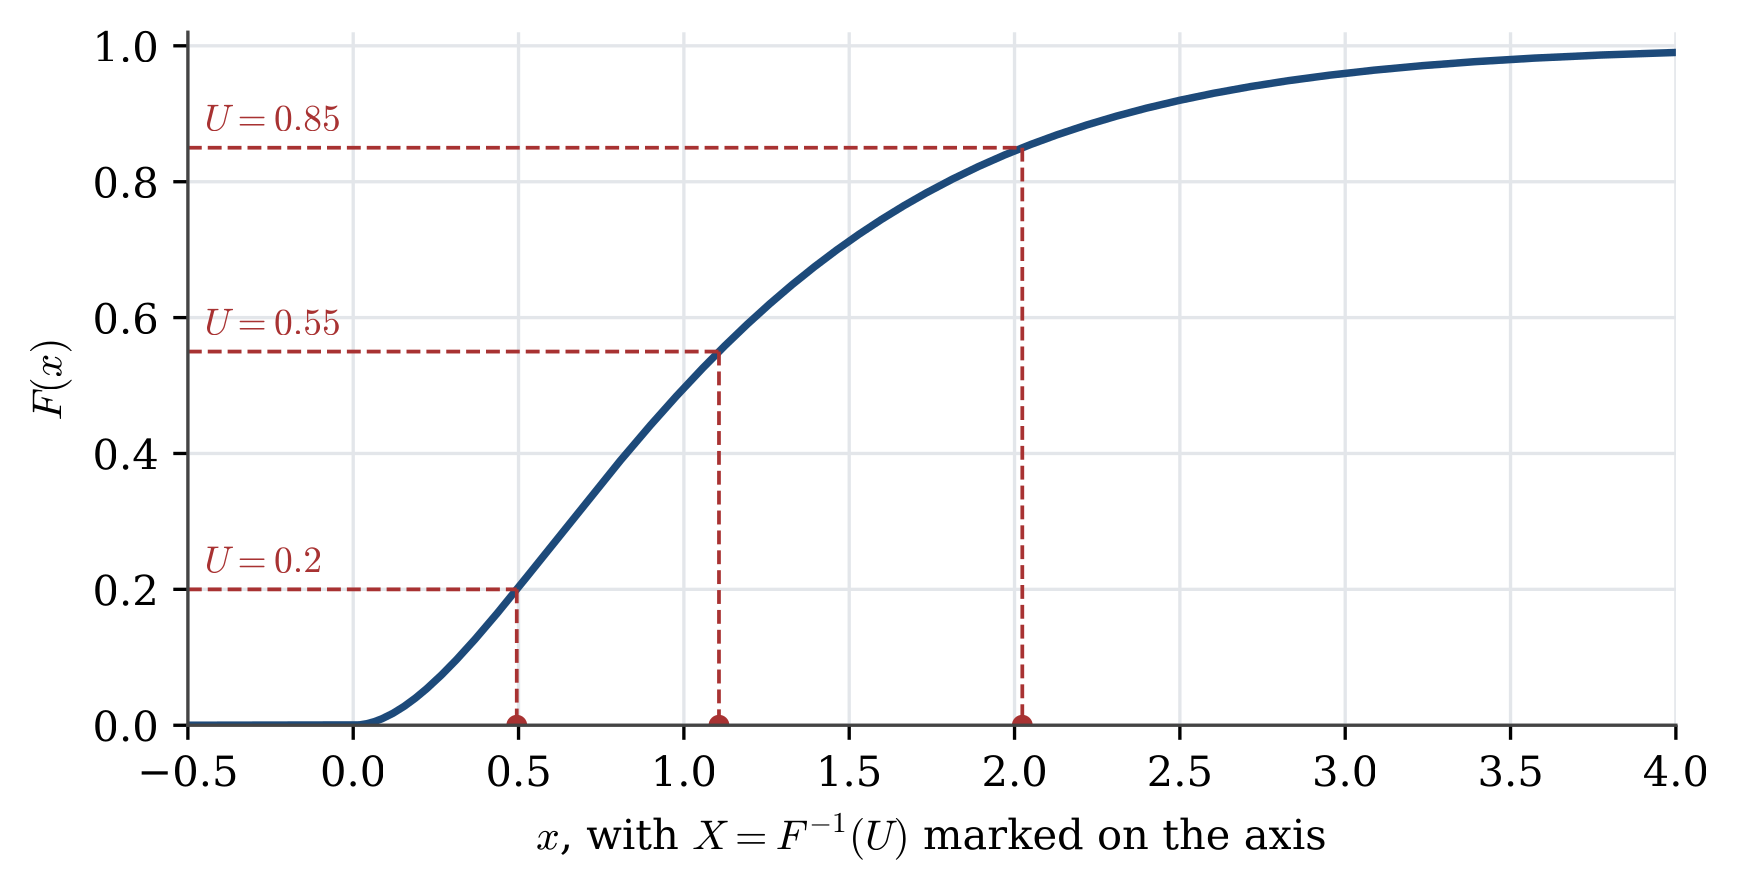
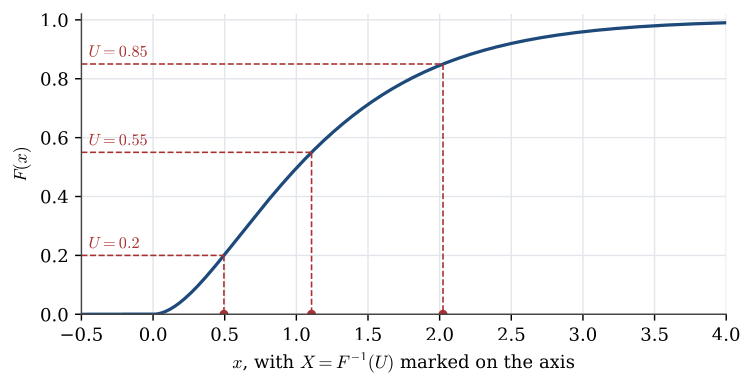
Description. The inverse-transform method. A uniform draw U on the vertical axis is carried across to the graph of F and down to the horizontal axis, giving X=F^{-1}(U). Steep parts of F catch many values of U, so X lands there often: that is where the density is large.
Appears in. Simulation
Made by. Drawn with Python and matplotlib from the example data. One script draws every figure in its section.
Download
- PNG, high resolution (1739 × 893 pixels, 76 KB)
- PNG, as shown on the wiki (754 × 387 pixels, 33 KB)
- PDF, vector, prints at any size (24 KB)
- Python script (
stat2003-make_figures.py)
File usage
These 3 pages show the file: