Designed experiment
Definition taught in Studies, data, and evidence, part of Data analysis
Designed experiment
| Type | Definition |
| Taught in | Studies, data, and evidence |
| Part | Data analysis |
| Worked examples | 3 |
| Questions using it | 3 |
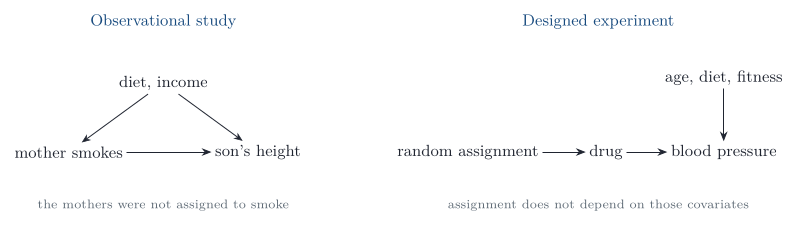
In a designed experiment some columns are controlled. Treatments are assigned to units, often at random, and those assignments stay the same if the measurements are repeated. The response column changes; the treatment column does not.
Examples
Alice’s caffeine experiment
Worked example from Studies, data, and evidence
Alice asks whether caffeinated cola raises the heart rate more than decaffeinated cola. She measures the heart rates of 20 friends, gives 10 of them 250 mL of caffeinated diet cola and 10 caffeine-free diet cola, waits half an hour, and measures again. The changes in beats per minute are
| Caffeinated | 17 | 22 | 21 | 16 | 6 | −2 | 27 | 15 | 16 | 20 |
| Decaf | 4 | 10 | 7 | −9 | 5 | 4 | 5 | 7 | 6 | 12 |
Question. Identify the response, the explanatory variable and the design choices, and summarise the data.
Solution. The experimental units are the 20 friends. The response is the change in heart rate, and the explanatory variable is caffeine, a factor with two levels. Several choices protect the comparison. Diet cola is compared with decaf diet cola because the two differ only in caffeine; regular and decaf regular cola also differ in sugar, energy and sodium. Half an hour is roughly the time caffeine takes to be absorbed. Choosing the 10 caffeine drinkers at random, rather than as, say, the 10 women, prevents a difference in heart rate from being a difference between the groups. Not telling the friends which drink they had, and ideally not telling whoever reads the pulse meter, prevents expectations from moving the response. Using friends at all limits the conclusion to people like Alice’s friends.
The decaf group’s mean change is 5.1 beats per minute and the caffeinated group’s is 15.8, a difference of 10.7. In a spreadsheet the data should be in standard form, one row per friend, with a column for the change and a column for the caffeine level:
alice <- data.frame(
  pb = c(17, 22, 21, 16, 6, -2, 27, 15, 16, 20, 4, 10, 7, -9, 5, 4, 5, 7, 6, 12),
  Caffeine = rep(c("Yes", "No"), each = 10)
)
tapply(alice$pb, alice$Caffeine, mean)
Whether a difference of 10.7 could easily arise by chance, with no effect of caffeine, is the question of the two-sample t test, worked in Testing examples.
A dose comparison for middle-of-the-night insomnia
Question page: A dose comparison for middle-of-the-night insomnia
Twenty-four patients with middle-of-the-night insomnia are randomly allocated to placebo, a low dose of triazolam, or a high dose. After two weeks, both active doses show a longer total sleep time than placebo.
What type of study is this?
What values can total sleep time take, and what type of variable is it?
What values can dosage take, and what type of variable is it?
Which variable is the response, and why?
A randomised designed experiment, a randomised controlled trial with a placebo arm.
Total sleep time is a duration, any non-negative number of minutes, so it is quantitative and continuous, though recorded to the nearest minute.
Dosage takes three values: placebo, low and high. It is categorical and ordinal, since the levels have a natural order. If the actual doses in milligrams were used, it could also be treated as quantitative.
Total sleep time is the response, because it is the outcome the drug is meant to change, and the dose is what the investigators set.
Facial tumours in Tasmanian devils
Question page: Facial tumours in Tasmanian devils
Thirty devils with facial tumours are split into two groups of 15. One group receives a new medicine and the other is untreated. Tumour size is recorded at the start and after 12 weeks.
Is this an observational study or a designed experiment? What is missing from the description before the quality of the comparison can be judged?
Which variable is the response, and what type of variable is it?
Which variable is explanatory, and what type of variable is it?
It is a designed experiment: the investigators decided which devils got the medicine. Before judging it we would want to know whether the groups were formed at random, whether whoever measured the tumours knew which devils were treated, whether the untreated group received a placebo or at least the same handling, and how comparable the devils were at the start in age, sex and tumour size. Fifteen per group is small, so a modest effect could be missed. Tumour size alone may also miss what matters, such as survival.
The response is the change in tumour size over the 12 weeks, or the size at 12 weeks adjusted for the starting size. It is quantitative and continuous. The question is whether the medicine changes it.
The explanatory variable is the treatment, medicine or none. It is categorical, a factor with two levels, and it is set by the investigators.
Used in
- Taught in Studies, data, and evidence, where the derivation and examples are.
- Also used in Descriptive statistics · Analysis of variance examples · Bayesian foundations
- Questions that use it (3) — Facial tumours in Tasmanian devils · A dose comparison for middle-of-the-night insomnia (answer) · Alcohol and school attendance
- All 6 questions on Studies, data, and evidence
See also
Observational study · Randomised controlled trial · Confounding variable · Blinding and placebo · Simple random sample · Stratified and cluster sampling