Randomised controlled trial
Definition taught in Studies, data, and evidence, part of Data analysis
Randomised controlled trial
| Type | Definition |
| Taught in | Studies, data, and evidence |
| Part | Data analysis |
| Worked examples | 3 |
| Questions using it | 1 |
In a randomised controlled trial each experimental unit receives one of several treatments, chosen at random with equal probability, and one of the treatments is a control, such as the standard treatment or a placebo. The response is then compared between the treatment groups.
Examples
Alice’s caffeine experiment
Worked example from Studies, data, and evidence
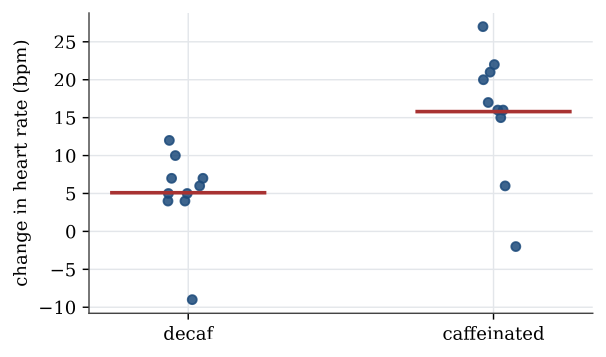
Alice asks whether caffeinated cola raises the heart rate more than decaffeinated cola. She measures the heart rates of 20 friends, gives 10 of them 250 mL of caffeinated diet cola and 10 caffeine-free diet cola, waits half an hour, and measures again. The changes in beats per minute are
| Caffeinated | 17 | 22 | 21 | 16 | 6 | −2 | 27 | 15 | 16 | 20 |
| Decaf | 4 | 10 | 7 | −9 | 5 | 4 | 5 | 7 | 6 | 12 |
Question. Identify the response, the explanatory variable and the design choices, and summarise the data.
Solution. The experimental units are the 20 friends. The response is the change in heart rate, and the explanatory variable is caffeine, a factor with two levels. Several choices protect the comparison. Diet cola is compared with decaf diet cola because the two differ only in caffeine; regular and decaf regular cola also differ in sugar, energy and sodium. Half an hour is roughly the time caffeine takes to be absorbed. Choosing the 10 caffeine drinkers at random, rather than as, say, the 10 women, prevents a difference in heart rate from being a difference between the groups. Not telling the friends which drink they had, and ideally not telling whoever reads the pulse meter, prevents expectations from moving the response. Using friends at all limits the conclusion to people like Alice’s friends.
The decaf group’s mean change is 5.1 beats per minute and the caffeinated group’s is 15.8, a difference of 10.7. In a spreadsheet the data should be in standard form, one row per friend, with a column for the change and a column for the caffeine level:
alice <- data.frame(
  pb = c(17, 22, 21, 16, 6, -2, 27, 15, 16, 20, 4, 10, 7, -9, 5, 4, 5, 7, 6, 12),
  Caffeine = rep(c("Yes", "No"), each = 10)
)
tapply(alice$pb, alice$Caffeine, mean)
Whether a difference of 10.7 could easily arise by chance, with no effect of caffeine, is the question of the two-sample t test, worked in Testing examples.
What a randomised trial does not need to record
Question page: What a randomised trial does not need to record
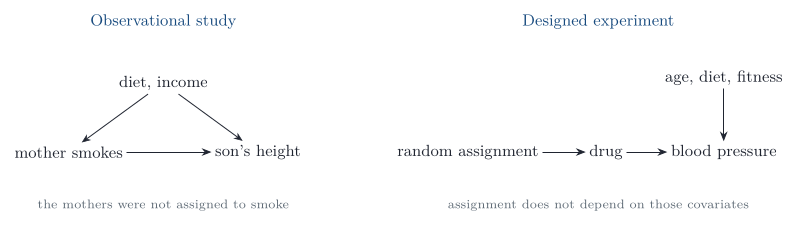
A trial of a new blood-pressure drug against an existing one will recruit at least 1000 adults aged 30 to 60 with systolic pressure at least 140 mm Hg, of any sex, fitness, occupation, or diet. The only columns required for the comparison are the assigned drug and the blood pressure before and after treatment. Why can age, sex, fitness, occupation, and diet be left unrecorded?
Because the drug is assigned at random, the two treatment groups have, apart from chance, the same distribution of age, sex, fitness, occupation and diet, and of every other variable, measured or not. None of them can then explain a difference in blood pressure between the groups: any systematic difference must be due to the drug. With 1000 or more subjects, chance imbalances are small. The other variables would still be useful for finding out whether the drug works better for some people than others, or for making the comparison more precise, but they are not needed for a valid comparison.
Randomising twenty people
Question page: Randomising twenty people
Twenty people are split at random into a test group and a control group of ten. How many different test groups are possible?
A test group is an unordered choice of 10 people from 20, so there are
\binom{20}{10}=\frac{20!}{10!\,10!}=184\,756
possible test groups. Randomisation picks one of them with equal probability, for example with sample(1:20, 10).
Figures
Used in
- Taught in Studies, data, and evidence, where the derivation and examples are.
- Questions that use it (1) — A dose comparison for middle-of-the-night insomnia (answer)
- All 6 questions on Studies, data, and evidence
See also
Blinding and placebo · Observational study · Designed experiment · Confounding variable · Simple random sample · Stratified and cluster sampling