One categorical variable, and two
Section of Descriptive statistics, part of Data analysis
One categorical variable, and two
| Type | Section |
| Taught in | Descriptive statistics |
| Part | Data analysis |
A categorical variable is summarised by counts, or by proportions. Of the 299 patients, 96 died during follow-up, a proportion of 0.32.
Two categorical variables are summarised by a contingency table: counts for every combination of categories.
Example 1 (Anaemia and death) Question. Did patients with anaemia die more often?
Solution.
table(heart$anaemia, heart$death, dnn = c("anaemia", "death"))
proportions(table(heart$anaemia, heart$death), margin = 1)| Survived | Died | Proportion died | |
|---|---|---|---|
| No anaemia | 120 | 50 | 0.294 |
| Anaemia | 83 | 46 | 0.357 |
Row proportions, margin = 1, compare the death rate within each anaemia group: 29.4% without anaemia and 35.7% with it. The difference is six percentage points. Whether that is more than chance would produce with groups this size is a chi-squared test of independence, and it is not: the p-value is 0.25. High blood pressure gives 29.4% against 37.1%, with p-value 0.17, while for diabetes, sex and smoking the rates in the two groups differ by less than two percentage points.
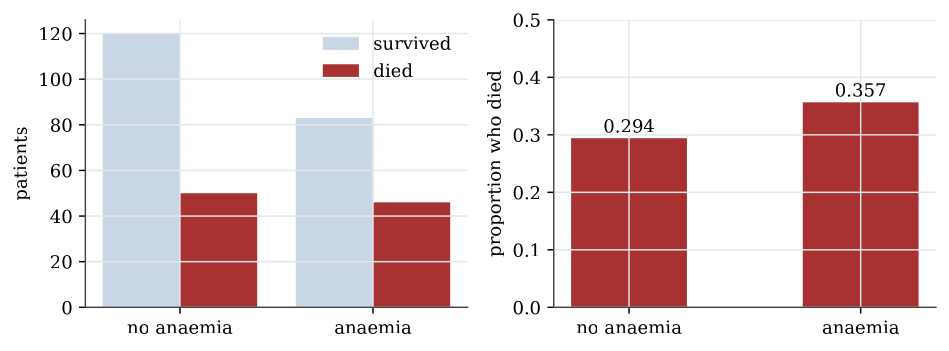
A bar plot shows counts or proportions by bars of proportional length. Side-by-side bars of counts mislead when the groups are of different sizes, which is why the proportions within each group are usually the plot to draw. A pie chart shows the same proportions as angles, which the eye compares less accurately than lengths.
Used in
See also
Sample quantile · Interquartile range · Sample variance and standard deviation · Five-number summary and boxplot · Normal quantile plot · Data table · Summary statistics · One quantitative variable