Scatterplot
Topic of Descriptive statistics, part of Data analysis · Also in Descriptive statistics
Scatterplot
| Type | Topic |
| Taught in | Descriptive statistics · Descriptive statistics |
| Part | Data analysis |
| Questions using it | 1 |
A plot of one quantitative variable against another, one point per unit. It shows the form, direction and strength of a relationship, and outliers, before any correlation or regression line summarises it.
In Descriptive statistics
Two quantitative variables are plotted against each other in a scatterplot, and their linear association is summarised by the sample correlation coefficient.
In Descriptive statistics, continued
Two quantitative variables are plotted against each other in a scatterplot, and their linear association is summarised by the sample correlation coefficient.
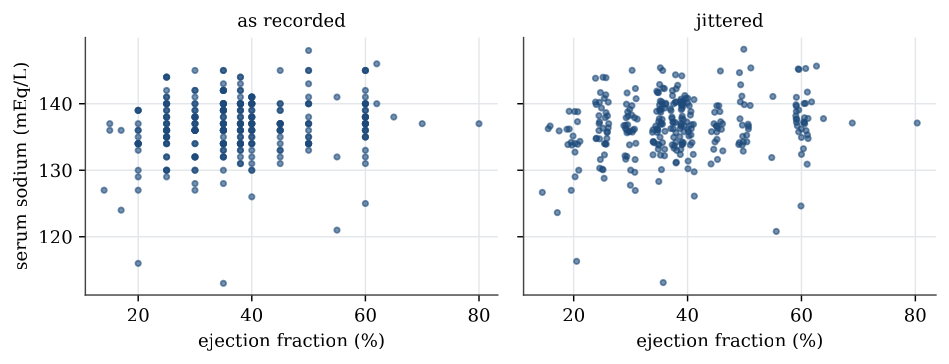
The ejection fraction was recorded in steps of 5 percentage points or so, with only 17 distinct values, and serum sodium as whole numbers. Many patients therefore share exactly the same point, and a plain scatterplot hides how many. Jittering, adding a small random amount to each coordinate before plotting, separates them; it changes the picture, not the data.
plot(jitter(serum_sodium) ~ jitter(ejection_fraction), data = heart)
cor(heart$serum_sodium, heart$ejection_fraction)   # 0.176
The correlation is 0.18: a weak tendency for patients with a higher ejection fraction to have more sodium. A correlation measures only linear association, and only in this sample; it does not say that one causes the other. Among the six quantitative measurements the largest correlation in absolute value is 0.19, between serum creatinine and sodium, so no pair moves strongly together.
Match the summary to the variable. Counts for categories, a centre and a spread for numbers, a scatterplot before a correlation. None of these is a conclusion about a parameter.
Used in
- Taught in Descriptive statistics · Descriptive statistics
- Also used in Using R · Regression examples · Introduction to generalised linear models · Covariance and the multivariate normal · High-dimensional analysis
- Questions that use it (1) — Question 19
- All 2 questions on Descriptive statistics
See also
Outlier · Correlation · Sample quantile · Interquartile range · Sample variance and standard deviation · Five-number summary and boxplot · Normal quantile plot · Data table