File:inf-np-region.png
Figure file · Most powerful tests
Size of this preview: 810 × 426 pixels. Select it to open the high-resolution file.
Summary
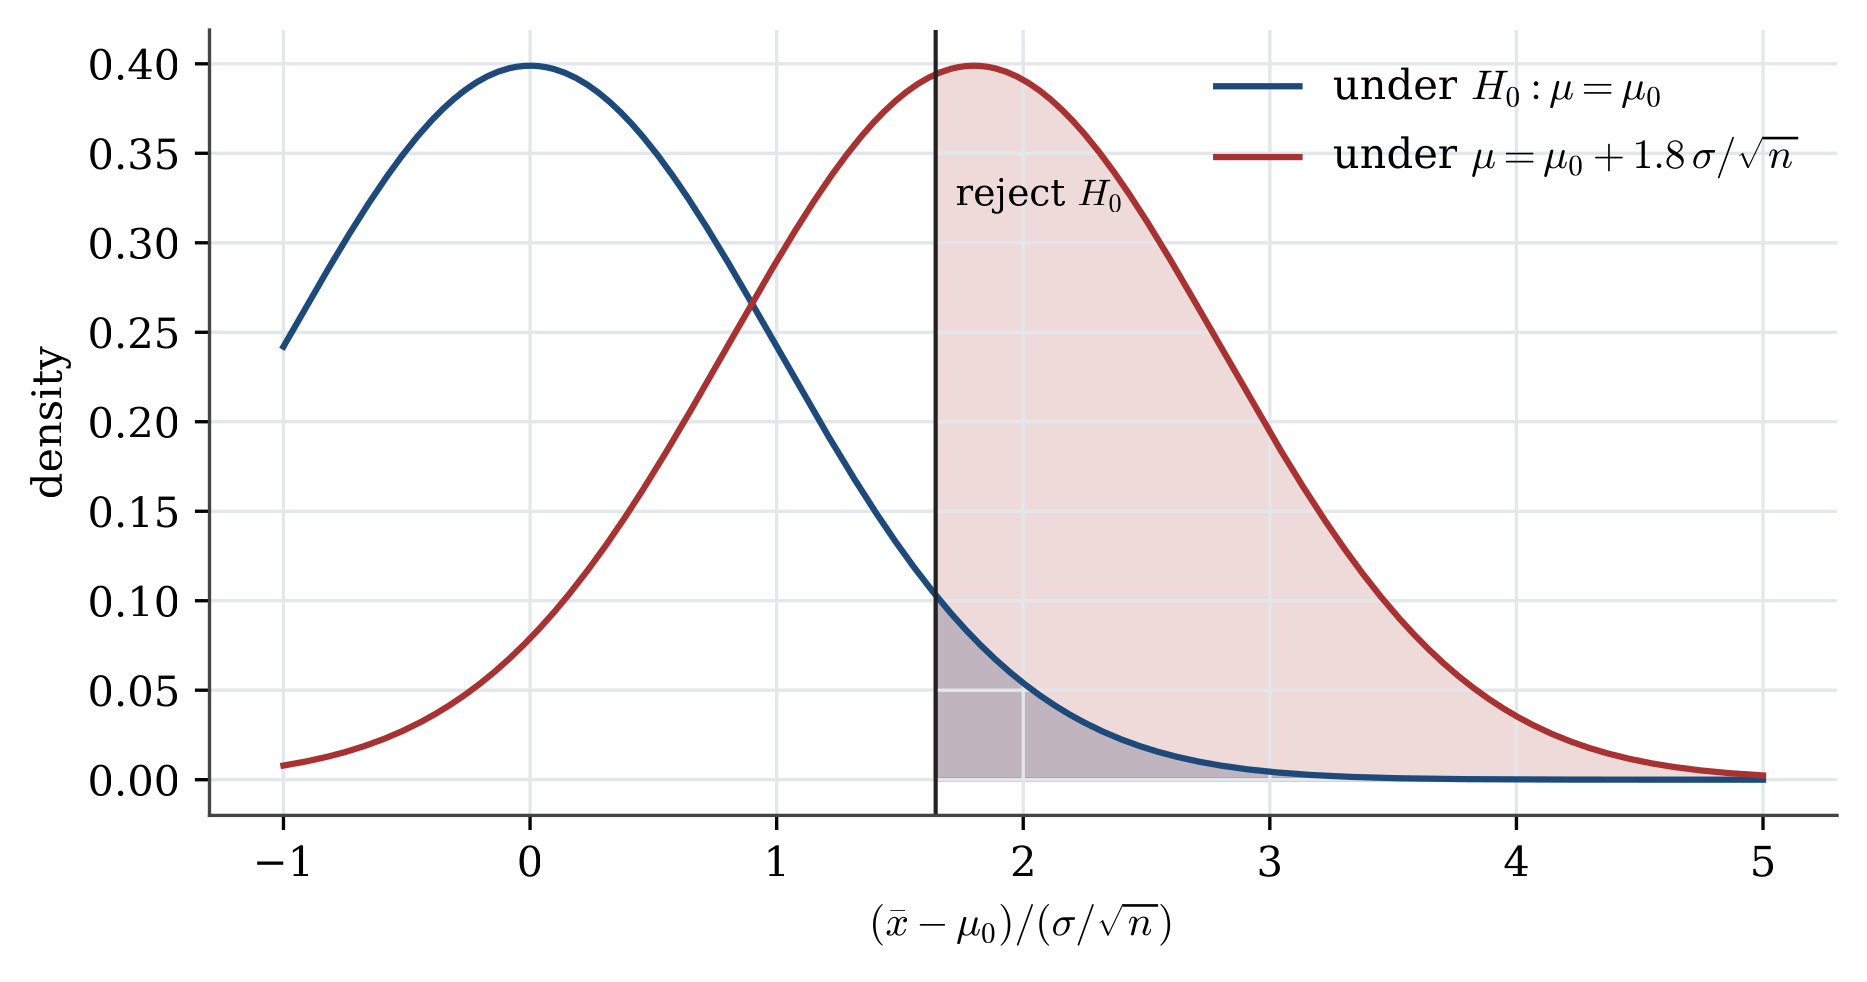
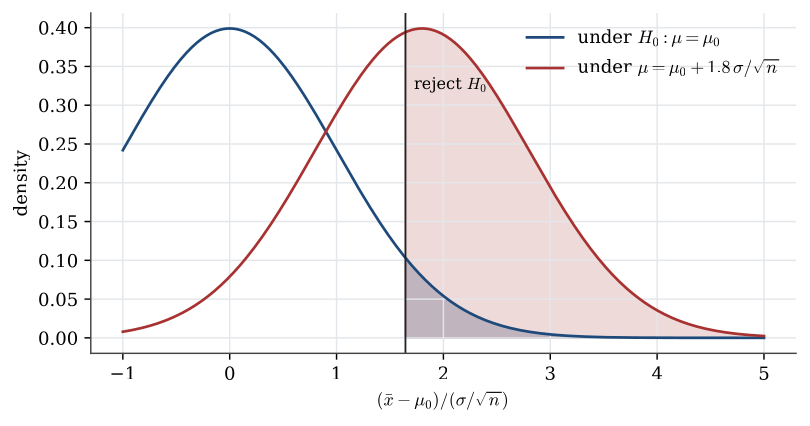
Description. Densities of (\overline X-\mu_0)/(\sigma/\sqrt n) under H_0 and under an alternative 1.8 standard errors above \mu_0. The most powerful level-0.05 test rejects to the right of 1.645. The shaded right tail under H_0 is the size. The shaded right tail under the alternative is the power.
Appears in. Most powerful tests
Made by. Drawn with Python and matplotlib from the example data. One script draws every figure in its section.
Download
- PNG, high resolution (1867 × 982 pixels, 123 KB)
- PNG, as shown on the wiki (810 × 426 pixels, 49 KB)
- PDF, vector, prints at any size (31 KB)
- Python script (
inference-make_figures.py)
File usage
This page shows the file: