File:part1-fig-09-regression-bands.png
Size of this preview: 708 × 390 pixels. Select it to open the high-resolution file.
Summary
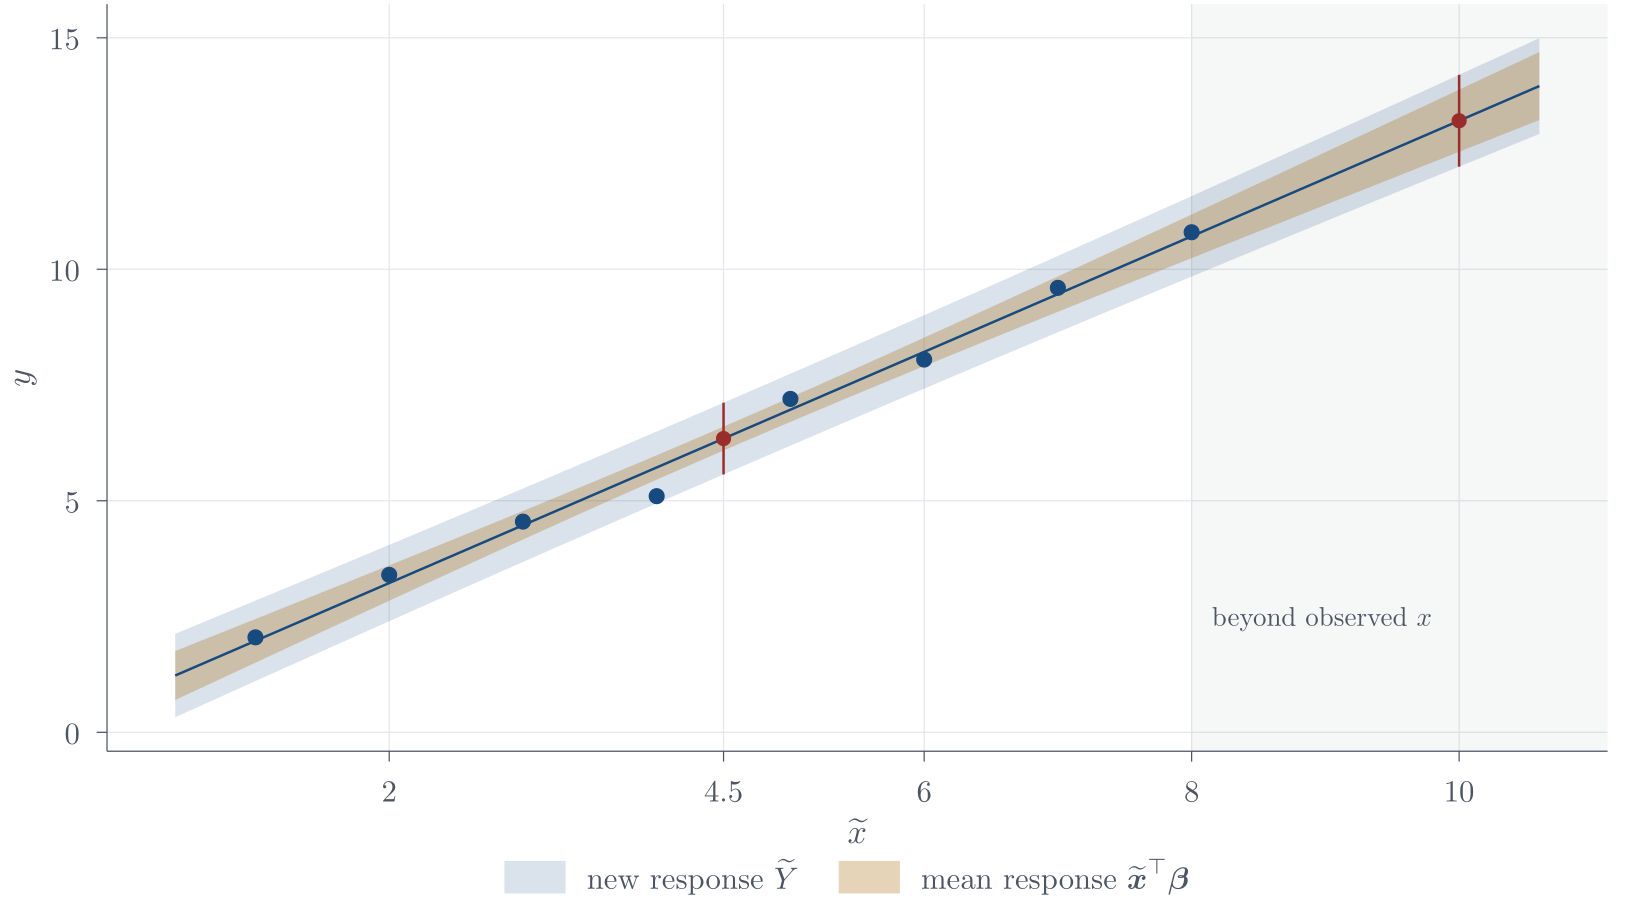
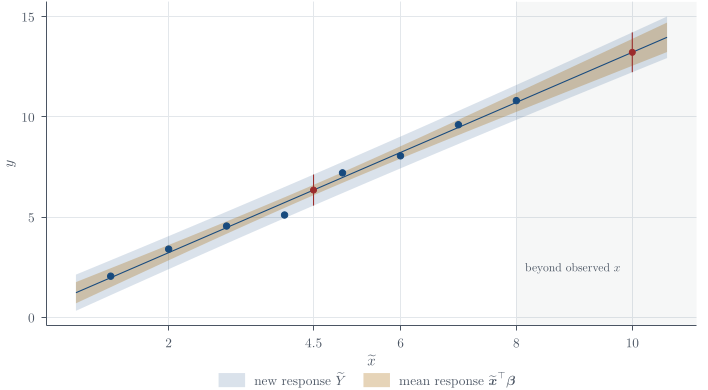
Description. The eight observations, the fitted line, and the two bands. The inner band is for the mean response and the outer for a new observation; the gap between them is the extra 1 in the predictive scale, which is why they never meet however small the leverage term becomes. The vertical rules mark the two predictions computed above, at \widetilde x=4.5 inside the data and \widetilde x=10 beyond it. Both bands are narrowest near \overline x and flare outward, so the cost of extrapolation is a feature of the geometry rather than a separate warning to remember.
Appears in. Bayesian linear regression
Made by. A figure from the course chapter.
Download
- PNG, high resolution (1634 × 900 pixels, 76 KB)
- PNG, as shown on the wiki (708 × 390 pixels, 26 KB)
- PDF, vector, prints at any size (68 KB)
File usage
These 5 pages show the file: