Gaussian linear model
Definition taught in Bayesian linear regression, part of Bayesian statistics
Gaussian linear model
| Type | Definition |
| Taught in | Bayesian linear regression |
| Part | Bayesian statistics |
| Properties | 5 |
| Worked examples | 3 |
Let {\boldsymbol{x}}_i^\top denote row i of {\color{blue}\boldsymbol{X}}. The Gaussian linear model is {\boldsymbol{Y}}={\color{blue}\boldsymbol{X}}{\boldsymbol{\beta}}+{\boldsymbol{\varepsilon}}, \qquad {\boldsymbol{\varepsilon}}\mid\sigma^2 \sim\operatorname{N}_n({\boldsymbol{0}},\sigma^2{\color{blue}\boldsymbol{I}}_n), and hence {\boldsymbol{Y}}\mid{\boldsymbol{\beta}},\sigma^2,{\color{blue}\boldsymbol{X}} \sim\operatorname{N}_n({\color{blue}\boldsymbol{X}}{\boldsymbol{\beta}},\sigma^2{\color{blue}\boldsymbol{I}}_n). Equivalently, the errors are independent with \varepsilon_i\sim\operatorname{N}(0,\sigma^2), so every response has variance \sigma^2 and distinct responses have zero covariance.
The design matrix is conditioned on and treated as fixed. This does not claim that its entries were never measured; it says that their uncertainty is not part of this particular model.
Properties
Ordinary least squares
Main article: Ordinary least squares
Assume that \operatorname{rank}({\color{blue}\boldsymbol{X}})=p. Then {\color{blue}\boldsymbol{X}}^\top{\color{blue}\boldsymbol{X}} is invertible and \boxed{\widehat{\boldsymbol{\beta}} =({\color{blue}\boldsymbol{X}}^\top{\color{blue}\boldsymbol{X}})^{-1}{\color{blue}\boldsymbol{X}}^\top{\boldsymbol{y}}.} The fitted residual vector and residual sum of squares are \widehat{{\boldsymbol{e}}}={\boldsymbol{y}}-{\color{blue}\boldsymbol{X}}\widehat{\boldsymbol{\beta}}, \qquad \operatorname{SSE} =\widehat{{\boldsymbol{e}}}^{\top}\widehat{{\boldsymbol{e}}} =\lVert\widehat{{\boldsymbol{e}}}\rVert_2^2 =\operatorname{SSE}(\widehat{\boldsymbol{\beta}}).
The maximum-likelihood estimator of \sigma^2 is \operatorname{SSE}/n. Estimating p coefficients consumes p degrees of freedom, so the usual unbiased estimator is s^2=\widehat\sigma^2=\frac{\operatorname{SSE}}{n-p}.
Sampling distribution of the OLS estimator
Main article: Sampling distribution of the OLS estimator
\widehat{\boldsymbol{\beta}}\mid{\boldsymbol{\beta}},\sigma^2,{\color{blue}\boldsymbol{X}} \sim\operatorname{N}_p\!\left( {\boldsymbol{\beta}},\sigma^2({\color{blue}\boldsymbol{X}}^\top{\color{blue}\boldsymbol{X}})^{-1}\right). Also, \frac{\operatorname{SSE}}{\sigma^2}\sim\chi^2_{n-p}, \qquad \widehat{\boldsymbol{\beta}}\ \text{is independent of }\operatorname{SSE}.
Least-squares decomposition
Main article: Least-squares decomposition
\boxed{ \begin{aligned} \operatorname{SSE}({\boldsymbol{\beta}}) &=\operatorname{SSE} +({\boldsymbol{\beta}}-\widehat{\boldsymbol{\beta}})^\top{\color{blue}\boldsymbol{X}}^\top{\color{blue}\boldsymbol{X}} ({\boldsymbol{\beta}}-\widehat{\boldsymbol{\beta}})\\ &=\operatorname{SSE} +\lVert{\boldsymbol{\beta}}-\widehat{\boldsymbol{\beta}}\rVert_{{\color{blue}\boldsymbol{X}}^\top{\color{blue}\boldsymbol{X}}}^2\\ &=\operatorname{SSE} +\lVert{\color{blue}\boldsymbol{X}}({\boldsymbol{\beta}}-\widehat{\boldsymbol{\beta}})\rVert_2^2. \end{aligned}} The second term is nonnegative because {\color{blue}\boldsymbol{X}}^\top{\color{blue}\boldsymbol{X}} is positive definite. This both proves that OLS minimises the SSE and separates the posterior’s coefficient uncertainty from its fitted residual variation. Geometrically, \widehat{{\boldsymbol{e}}} is orthogonal to the column space of {\color{blue}\boldsymbol{X}}, while {\color{blue}\boldsymbol{X}}(\widehat{\boldsymbol{\beta}}-{\boldsymbol{\beta}}) lies in that column space. The theorem is therefore the Pythagorean theorem for those two orthogonal components of the candidate residual vector.
Marginal Student posterior
Main article: Marginal Student posterior
\boxed{ {\boldsymbol{\beta}}\mid{\boldsymbol{y}},{\color{blue}\boldsymbol{X}} \sim t_{n-p}\!\left( \widehat{\boldsymbol{\beta}}, s^2({\color{blue}\boldsymbol{X}}^\top{\color{blue}\boldsymbol{X}})^{-1}\right),} where the displayed matrix is the multivariate t scale matrix. In particular, \beta_j\mid{\boldsymbol{y}},{\color{blue}\boldsymbol{X}} \sim t_{n-p}\!\left(\widehat\beta_j,s\sqrt{c_{jj}}\right), so an equal-tailed 100(1-\alpha)\% credible interval is \widehat\beta_j\ \pm\ t_{1-\alpha/2,n-p}s\sqrt{c_{jj}}. Its endpoints coincide with the usual classical interval under this reference prior. The interpretations do not coincide: the Bayesian statement concerns posterior uncertainty about \beta_j for the observed data, whereas the frequentist statement concerns repeated-sample coverage by a random interval.
Posterior prediction under the reference prior
Main article: Posterior prediction under the reference prior
\boxed{ \widetilde Y\mid{\boldsymbol{y}},{\color{blue}\boldsymbol{X}},\widetilde{\boldsymbol{x}} \sim t_{n-p}\!\left( \widetilde{\boldsymbol{x}}^\top\widehat{\boldsymbol{\beta}}, s\sqrt{1+h(\widetilde{\boldsymbol{x}})}\right).} For the unknown mean response itself, there is no new observational error: \widetilde{\boldsymbol{x}}^\top{\boldsymbol{\beta}}\mid{\boldsymbol{y}},{\color{blue}\boldsymbol{X}} \sim t_{n-p}\!\left( \widetilde{\boldsymbol{x}}^\top\widehat{\boldsymbol{\beta}}, s\sqrt{h(\widetilde{\boldsymbol{x}})}\right).
Examples
Eight-point regression
Worked example from Bayesian linear regression
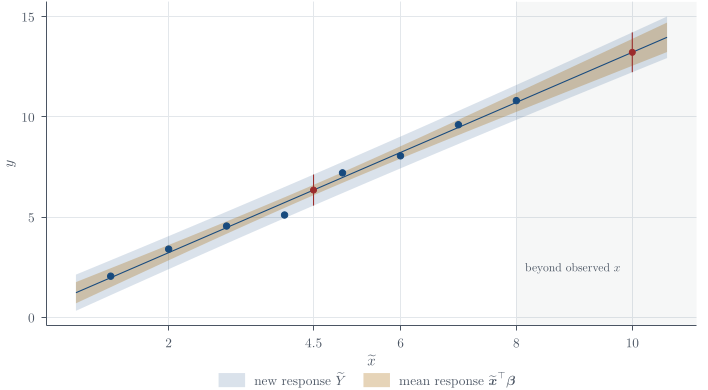
Consider n=8 observations with one predictor and an intercept:
{\boldsymbol{x}}=(1,2,3,4,5,6,7,8)^{\mathsf T}, \qquad {\boldsymbol{y}}=(2.05,3.40,4.55,5.10,7.20,8.05,9.60,10.80)^\top.
Question. Under the reference-prior analysis developed above, compute \widehat{\boldsymbol{\beta}}, the fitted sum of squared errors, the posterior distributions of \sigma^2 and {\boldsymbol{\beta}}, and marginal 95\% credible intervals for the two regression coefficients. Then derive posterior predictive distributions at \widetilde x=4.5 and \widetilde x=10 and explain the effect of extrapolation.
Solution. For this example put the intercept first, so the ith row of {\color{blue}\boldsymbol{X}} is (1,x_i). Direct summation gives
\sum_i y_i=50.75, \qquad \sum_i x_i y_i=280.80, \qquad \sum_i y_i^2=387.9175.
Therefore
{\color{blue}\boldsymbol{X}}^\top{\color{blue}\boldsymbol{X}}= \begin{pmatrix}8&36\\36&204\end{pmatrix}, \qquad {\color{blue}\boldsymbol{X}}^\top{\boldsymbol{y}}= \begin{pmatrix}50.75\\280.80\end{pmatrix}.
The determinant is 8(204)-36^2=336, so
({\color{blue}\boldsymbol{X}}^\top{\color{blue}\boldsymbol{X}})^{-1} =\frac1{336}\begin{pmatrix}204&-36\\-36&8\end{pmatrix} =\begin{pmatrix} 0.607143&-0.107143\\ -0.107143&0.023810 \end{pmatrix}.
Multiplying by {\color{blue}\boldsymbol{X}}^\top{\boldsymbol{y}}, \begin{align*} \widehat{\boldsymbol{\beta}} &=\frac1{336} \begin{pmatrix}204&-36\\-36&8\end{pmatrix} \begin{pmatrix}50.75\\280.80\end{pmatrix}\\ &=\frac1{336} \begin{pmatrix} 204(50.75)-36(280.80)\\ -36(50.75)+8(280.80) \end{pmatrix}\\ &=\begin{pmatrix}0.726786\\1.248214\end{pmatrix}. \end{align*} The fitted SSE can be calculated without listing every residual: \begin{align*} \operatorname{SSE} &={\boldsymbol{y}}^\top{\boldsymbol{y}}-\widehat{\boldsymbol{\beta}}^\top{\color{blue}\boldsymbol{X}}^\top{\boldsymbol{y}}\\ &=387.9175 -\frac{244.2}{336}(50.75)-\frac{419.4}{336}(280.80)\\ &\approx0.534554. \end{align*} The exact coefficients are kept here rather than the six-figure decimals printed above. The subtraction cancels almost everything: two quantities near 387.9 leave a remainder near 0.53, so rounding \widehat{\boldsymbol{\beta}} first costs about four significant figures in \operatorname{SSE}. Summing the squared residuals directly avoids the cancellation entirely.
Thus n-p=6 and
s^2=\frac{0.534554}{6}\approx0.089092.
Under the reference prior, \begin{align*} \sigma^2\mid{\boldsymbol{y}} &\sim\operatorname{InvGamma}(3,0.267277),\\ {\boldsymbol{\beta}}\mid{\boldsymbol{y}} &\sim t_6\!\left( \begin{pmatrix}0.726786\\1.248214\end{pmatrix}, 0.089092 \begin{pmatrix} 0.607143&-0.107143\\ -0.107143&0.023810 \end{pmatrix}\right). \end{align*} The variance summaries illustrate why the loss function matters:
\mathbb{E}(\sigma^2\mid{\boldsymbol{y}})=\frac{0.267277}{3-1}=0.133638, \qquad \operatorname{mode}(\sigma^2\mid{\boldsymbol{y}}) =\frac{0.267277}{3+1}=0.066819,
while s^2=0.089092. Using t_{0.975,6}\approx2.447, the marginal 95\% credible intervals are approximately
\beta_0\mid{\boldsymbol{y}}:\ (0.158,1.296), \qquad \beta_1\mid{\boldsymbol{y}}:\ (1.136,1.361).
At \widetilde x=4.5, take \widetilde{\boldsymbol{x}}=(1,4.5)^\top. Matrix multiplication gives
h(\widetilde{\boldsymbol{x}}) =(1,4.5)({\color{blue}\boldsymbol{X}}^\top{\color{blue}\boldsymbol{X}})^{-1} \begin{pmatrix}1\\4.5\end{pmatrix}=0.125,
and the predicted centre is
\widetilde{\boldsymbol{x}}^\top\widehat{\boldsymbol{\beta}} =0.726786+4.5(1.248214)=6.34375.
Consequently,
\widetilde Y\mid{\boldsymbol{y}},\widetilde x=4.5 \sim t_6\!\left(6.34375, \sqrt{0.089092(1.125)}\right) \approx t_6(6.344,0.317).
At \widetilde x=10, the centre is about 13.209 and h(\widetilde{\boldsymbol{x}})\approx0.845, giving predictive scale about 0.405. The increase from 0.317 is the uncertainty cost of extrapolating beyond the observed predictor range.
Q24. Bayesian regression and prediction
Question page: Q24. Bayesian regression and prediction
[12 marks]
Consider the regression model Y_i=\beta_0+\beta_1x_i+\varepsilon_i, \qquad \varepsilon_i\overset{\mathrm{iid}}{\sim}N(0,\sigma^2), with reference prior p(\beta_0,\beta_1,\sigma^2)\propto1/\sigma^2 for (\beta_0,\beta_1)\in\mathbb{R}^2 and \sigma^2>0. For n=10 observations, the design matrix has rows (1,x_i), and \widehat{\boldsymbol\beta}=\begin{pmatrix}1\\2\end{pmatrix}, \qquad (X^\top X)^{-1}=\begin{pmatrix}1/10&0\\0&1/40\end{pmatrix}, \qquad \operatorname{SSE}=16. The observed predictor values range from -3 to 3.
You may use the standard regression posterior formulas under this prior. Use the inverse-Gamma convention f(v)\propto v^{-a-1}e^{-b/v}. Write t_\nu(m,s) for a Student-t distribution with location m and scale s, and use t_{0.975,8}=2.306.
(a) [2 marks] State the marginal posterior distribution of \sigma^2 and calculate \mathbb{E}(\sigma^2\mid\mathbf y,X).
(b) [3 marks] State the marginal posterior distribution of the slope \beta_1, and calculate its equal-tailed 95% credible interval.
(c) [4 marks] At x_*=0, derive the posterior distributions and equal-tailed 95% intervals for:
(i) the unknown mean response \mu_*=\beta_0+\beta_1x_*;
(ii) a new observation \widetilde Y.
Explain precisely why the second interval is wider.
(d) [3 marks] Calculate h(x_*)=(1,x_*)(X^\top X)^{-1}(1,x_*)^\top at x_*=0 and x_*=4. Compare the posterior predictive scales at these points and explain how the calculation reflects uncertainty from extrapolation.
Definitions. Write D=(\mathbf y,X), v=\sigma^2, and \operatorname{SSE}=\|\mathbf y-X\widehat{\boldsymbol\beta}\|^2. The inverse-Gamma kernel is v^{-a-1}e^{-b/v} on v>0. t_\nu(m,s) denotes location m, scale s, and \nu degrees of freedom: (T-m)/s\sim t_\nu. A scale is not a variance; t_{q,\nu} denotes the q quantile of standard t_\nu.
Assumptions. Use independent Normal errors, fixed covariates, full column rank X, n>p, positive SSE, and the reference prior p(\boldsymbol\beta,v)\propto1/v with respect to d\boldsymbol\beta\,dv. These rank and residual conditions ensure a proper posterior despite the improper prior.
There are p=2 regression coefficients, including the intercept. Define \nu=n-p=8,\qquad s^2=\frac{\operatorname{SSE}}{n-p}=\frac{16}{8}=2, \qquad C=(X^\top X)^{-1}. Here s^2 is the residual variance estimate; it is not the posterior mean of \sigma^2.
Why the regression posterior has this form. The likelihood times the reference prior gives p(\boldsymbol\beta,v\mid D) \propto v^{-n/2-1} \exp\{-\|\mathbf y-X\boldsymbol\beta\|^2/(2v)\}, \qquad v=\sigma^2>0. Expand about the least-squares estimate. The cross term vanishes because X^\top(\mathbf y-X\widehat{\boldsymbol\beta})=\mathbf0, giving \|\mathbf y-X\boldsymbol\beta\|^2 =\operatorname{SSE} +(\boldsymbol\beta-\widehat{\boldsymbol\beta})^\top X^\top X(\boldsymbol\beta-\widehat{\boldsymbol\beta}). The second term is a Normal quadratic. At fixed v it identifies \boldsymbol\beta\mid v,D\sim N_p(\widehat{\boldsymbol\beta},vC). Its unnormalised exponential integrates to (2\pi v)^{p/2}|X^\top X|^{-1/2}, which explains the v^{p/2} factor in the variance marginal below.
(a) Marginal variance posterior. Under the stated reference prior, \sigma^2\mid D\sim\operatorname{InvGamma}\left(\frac{n-p}{2}, \frac{\operatorname{SSE}}2\right). Thus \boxed{\sigma^2\mid D\sim\operatorname{InvGamma}(4,8),\qquad\sigma^2>0.} An \operatorname{InvGamma}(a,b) variable has mean b/(a-1) when a>1, so \boxed{\mathbb{E}(\sigma^2\mid D)=\frac8{4-1}=\frac83\approx2.6667.} For completeness, integrating the coefficient kernel out of the joint posterior contributes a factor (\sigma^2)^{p/2}. Therefore p(\sigma^2\mid D) \propto (\sigma^2)^{-(n/2+1)}(\sigma^2)^{p/2} \exp\!\left(-\frac{\operatorname{SSE}}{2\sigma^2}\right) =(\sigma^2)^{-5}e^{-8/\sigma^2}, confirming the shape 4, not n/2=5.
(b) Slope posterior and credible interval. The conditional coefficient posterior is \boldsymbol\beta\mid\sigma^2,D \sim N_2(\widehat{\boldsymbol\beta},\sigma^2 C). The slope entry of C is 1/40, so \beta_1\mid\sigma^2,D\sim N\!\left(2,\frac{\sigma^2}{40}\right). Integrating over \sigma^2\mid D gives \boxed{\beta_1\mid D\sim t_8\!\left(2,\sqrt{\frac2{40}}\right) =t_8(2,\sqrt{0.05}).} Equivalently, (\beta_1-2)/\sqrt{0.05}\mid D\sim t_8. The equal-tailed 95% credible interval is therefore 2\pm2.306\sqrt{0.05}=2\pm0.5156, \qquad\boxed{(1.484,\,2.516).} The second argument of t_8 is a scale, not a variance. There is no additional division by \sqrt n: sample-size information is already in C.
(c) Mean response versus a new observation at x_*=0. For a general predictor value, set \mathbf z_*=(1,x_*)^\top and write m_*=\mathbf z_*^\top\widehat{\boldsymbol\beta}, \qquad h(x_*)=\mathbf z_*^\top C\mathbf z_*. The linear-transformation rule for a normal vector gives \mu_*\mid\sigma^2,D \sim N\bigl(m_*,\sigma^2 h(x_*)\bigr). For a new response \widetilde Y=\mu_*+\widetilde\varepsilon, the new error is independent of the coefficient uncertainty conditional on \sigma^2,D, and has variance \sigma^2. Thus \widetilde Y\mid\sigma^2,D,x_* \sim N\bigl(m_*,\sigma^2\{1+h(x_*)\}\bigr). Integrating over the inverse-Gamma variance posterior gives \mu_*\mid D\sim t_8\bigl(m_*,s\sqrt{h(x_*)}\bigr), \widetilde Y\mid D,x_*\sim t_8\bigl(m_*,s\sqrt{1+h(x_*)}\bigr). At x_*=0, m_*=(1,0)\begin{pmatrix}1\\2\end{pmatrix}=1, \qquad h(0)=\frac1{10}. Therefore the unknown mean response has posterior \boxed{\mu_*\mid D\sim t_8(1,\sqrt{0.2}),} with equal-tailed 95% credible interval 1\pm2.306\sqrt{0.2}=1\pm1.0313, \qquad\boxed{(-0.031,\,2.031).} The new observation has posterior predictive distribution \boxed{\widetilde Y\mid D,x_*=0\sim t_8(1,\sqrt{2.2}),} with equal-tailed 95% predictive interval 1\pm2.306\sqrt{2.2}=1\pm3.4204, \qquad\boxed{(-2.420,\,4.420).} Both intervals have the same centre and use the same t_8 quantile. The predictive interval is wider because a new observation includes both uncertainty about the regression mean and fresh observational noise. That additional noise produces the extra 1 in 1+h(x_*).
(d) Extrapolation and predictive scale. Using the supplied diagonal matrix, \begin{aligned} h(x_*)&=(1,x_*) \begin{pmatrix}1/10&0\\0&1/40\end{pmatrix} \begin{pmatrix}1\\x_*\end{pmatrix}\\ &=\frac1{10}+\frac{x_*^2}{40}. \end{aligned} Hence \boxed{h(0)=0.1,\qquad h(4)=0.1+\frac{16}{40}=0.5.} The corresponding predictive scales are \boxed{s_{\mathrm{pred}}(0)=\sqrt{2(1+0.1)}=\sqrt{2.2}\approx1.4832,} \boxed{s_{\mathrm{pred}}(4)=\sqrt{2(1+0.5)}=\sqrt3\approx1.7321.} At x_*=4, the predicted centre is 1+2(4)=9, so the predictive distribution is t_8(9,\sqrt3). Its interval is wider than at x_*=0 because it has the same degrees of freedom but a larger scale.
The value 4 lies outside the observed range [-3,3]. Uncertainty about the slope has a greater effect on the fitted mean farther from the centred design, increasing h(x_*). The future-error contribution is unchanged; the increased width comes from greater parameter uncertainty in the prediction. This calculation assumes the linear model remains appropriate beyond the observed range; it does not account for possible failure of that model there.
Key result. The mean-response scale is s\sqrt h; the new-observation scale is s\sqrt{1+h}. The extra 1 represents new observational noise, while h measures uncertainty about the fitted mean.
Question 5. Normal–inverse-\chi^2 regression
Question page: Question 5. Normal–inverse-\chi^2 regression
Suppose
y\mid\beta,\sigma^2,X\sim \operatorname{N}_n(X\beta,\sigma^2 I_n),
with prior
\beta\mid\sigma^2\sim \operatorname{N}_p(\beta_0,\sigma^2\Sigma_0), \qquad \sigma^2\sim\operatorname{Inv\text{-}\chi^2}(\mu_0,\sigma_0^2).
Here X is known, \Sigma_0 is positive definite, and \mu_0,\sigma_0^2>0. The inverse-\chi^2 convention is
\frac{\mu_0\sigma_0^2}{\sigma^2}\sim\chi^2_{\mu_0}.
(a) State the inverse-\chi^2 prior kernel and its equivalent inverse-gamma parameters.
(b) State the updated parameters \Sigma_n and \beta_n.
(c) State the updated parameters \mu_n and \sigma_n^2.
(d) Express the joint posterior through a conditional posterior for \beta and a marginal posterior for \sigma^2.
(e) Express the updated scale using a residual sum of squares and a prior penalty. Explain why it is positive.
(f) Is \Sigma_n the conditional covariance matrix of \beta? Is \sigma_n^2 the posterior mean of \sigma^2? Give the correct expressions and the posterior mode of \sigma^2.
(g) State the full conditional posterior of \sigma^2\mid\beta,y,X. How does it differ from its marginal posterior?
(h) Without consulting the updates, complete the square to reconstruct them. Explain why the marginal degrees of freedom are \mu_0+n.
Definitions. There are n responses and p regression coefficients; X is an n\times p known design matrix. Write v=\sigma^2. The matrix \Sigma_0 scales the conditional prior covariance v\Sigma_0. In this question \mu_0 denotes prior degrees of freedom, not a normal mean. Our \operatorname{Inv\text{-}\chi^2}(\nu,s^2) convention means \nu s^2/v\sim\chi^2_\nu, or equivalently v\sim\operatorname{InvGamma}(\nu/2,\nu s^2/2).
(a) The transformation \mu_0\sigma_0^2/\sigma^2\sim\chi^2_{\mu_0} has kernel
\pi(\sigma^2) \propto (\sigma^2)^{-\mu_0/2-1} \exp\Bigl(-\frac{\mu_0\sigma_0^2}{2\sigma^2}\Bigr), \qquad\sigma^2>0.
Matching (\sigma^2)^{-a-1}\exp(-b/\sigma^2) gives a=\mu_0/2 and b=\mu_0\sigma_0^2/2.
For completeness, if U=\mu_0\sigma_0^2/v, then |dU/dv|=\mu_0\sigma_0^2/v^2. Multiplying the \chi^2_{\mu_0} density at U by this Jacobian gives the displayed inverse-gamma kernel. The Jacobian supplies the power v^{-2} and must be retained.
\boxed{ \sigma^2\sim\operatorname{InvGamma}\Bigl(\frac{\mu_0}{2},\frac{\mu_0\sigma_0^2}{2}\Bigr). }
(b) Since \Sigma_0^{-1} is positive definite and X^\top X is positive semidefinite, \Sigma_n^{-1} is positive definite. Precision addition gives
\boxed{\Sigma_n^{-1}=X^\top X+\Sigma_0^{-1},} \qquad \boxed{\beta_n=\Sigma_n(X^\top y+\Sigma_0^{-1}\beta_0).}
The data and prior precision contributions add, and their combined precision determines the posterior centre.
At fixed v, the likelihood contributes X^\top X/v to the precision of \beta, and the prior contributes \Sigma_0^{-1}/v. Their sum is \Sigma_n^{-1}/v. A proper positive-definite prior therefore gives a proper conditional update even if X is not of full column rank; an unregularised least-squares inverse (X^\top X)^{-1} is not needed.
(c)
\boxed{\mu_n=\mu_0+n,} \qquad \boxed{ \sigma_n^2 = \frac{ \mu_0\sigma_0^2+y^\top y+\beta_0^\top\Sigma_0^{-1}\beta_0 -\beta_n^\top\Sigma_n^{-1}\beta_n }{\mu_n}. }
(d)
\boxed{\beta\mid\sigma^2,y,X\sim \operatorname{N}_p(\beta_n,\sigma^2\Sigma_n),} \qquad \boxed{\sigma^2\mid y,X\sim\operatorname{Inv\text{-}\chi^2}(\mu_n,\sigma_n^2).}
Together these specify a normal–inverse-\chi^2 joint posterior.
This is a conditional–marginal factorisation. To draw an independent posterior pair, draw v from the marginal inverse-\chi^2 distribution and then \beta from its normal distribution conditional on that v. The components within a pair are dependent through the conditional covariance, even though different pairs can be generated independently.
(e) Equivalently,
\mu_n\sigma_n^2 = \mu_0\sigma_0^2 +(y-X\beta_n)^\top(y-X\beta_n) +(\beta_n-\beta_0)^\top\Sigma_0^{-1}(\beta_n-\beta_0).
Both quadratic forms are nonnegative and \mu_0\sigma_0^2>0, so \sigma_n^2>0. The algebra is completed in (h).
(f) No. The conditional covariance is \sigma^2\Sigma_n, not \Sigma_n:
\boxed{\operatorname{Var}(\beta\mid\sigma^2,y,X)=\sigma^2\Sigma_n.}
The parameter \sigma_n^2 is a scale. By the inverse-gamma equivalence in (a),
\boxed{ \mathbb{E}(\sigma^2\mid y,X) = \frac{\mu_n\sigma_n^2}{\mu_n-2}, \qquad\mu_n>2, }
and
\boxed{ \operatorname{mode}(\sigma^2\mid y,X) = \frac{\mu_n\sigma_n^2}{\mu_n+2}. }
(g)
\boxed{ \sigma^2\mid\beta,y,X \sim \operatorname{Inv\text{-}\chi^2}\!\left( \mu_n+p,\; \frac{\mu_n\sigma_n^2+(\beta-\beta_n)^\top\Sigma_n^{-1}(\beta-\beta_n)}{\mu_n+p} \right). }
The full conditional fixes \beta. The marginal posterior integrates \beta out, which removes p from the degrees of freedom.
The difference comes from the normal density’s factor v^{-p/2}. It remains when \beta is fixed and therefore adds p/2 to the inverse-gamma shape. Integrating over \beta instead contributes a factor v^{p/2}, cancelling it. Substituting \beta=\beta_n in the full conditional would leave the wrong degrees of freedom.
(h) Expand the likelihood quadratic and the prior quadratic:
\begin{aligned} &(y-X\beta)^\top(y-X\beta) +(\beta-\beta_0)^\top\Sigma_0^{-1}(\beta-\beta_0)\\ &\quad= \beta^\top(X^\top X+\Sigma_0^{-1})\beta -2\beta^\top(X^\top y+\Sigma_0^{-1}\beta_0) +y^\top y+\beta_0^\top\Sigma_0^{-1}\beta_0\\ &\quad= (\beta-\beta_n)^\top\Sigma_n^{-1}(\beta-\beta_n) +y^\top y+\beta_0^\top\Sigma_0^{-1}\beta_0 -\beta_n^\top\Sigma_n^{-1}\beta_n. \end{aligned}
Adding \mu_0\sigma_0^2, the terms free of \beta are the numerator of \mu_n\sigma_n^2 in (c), with \mu_n=\mu_0+n. Thus
\boxed{ Q(\beta) = (\beta-\beta_n)^\top\Sigma_n^{-1}(\beta-\beta_n) +\mu_n\sigma_n^2. }
The joint posterior kernel is
(\sigma^2)^{-(\mu_0+n+p)/2-1} \exp\Bigl(-\frac{Q(\beta)}{2\sigma^2}\Bigr).
The integral over \beta of the normal kernel equals (2\pi\sigma^2)^{p/2}|\Sigma_n|^{1/2}. The remaining power of \sigma^2 is
-\frac{\mu_0+n+p}{2}-1+\frac p2 = -\frac{\mu_0+n}{2}-1.
\therefore \text{the marginal inverse-}\chi^2\text{ degrees of freedom are }\mu_0+n.
Used in
- Taught in Bayesian linear regression, where the derivation and examples are.
- All 8 questions on Bayesian linear regression
See also
Error and residual · Ordinary least squares · Sampling distribution of the OLS estimator · Studentised coefficient pivot · Least-squares decomposition · Conditional coefficient posterior · Marginal variance posterior · Marginal Student posterior