Binomial counts in a GLM
Section of Standard errors, and models for counts, part of Generalised linear models
Binomial counts in a GLM
| Type | Section |
| Taught in | Standard errors, and models for counts |
| Part | Generalised linear models |
Often we do not record a zero or a one for every beetle, patient, or firm. We apply a treatment to a group and count the successes. Group sizes need not match. If the members of a group are independent, the likelihood is the Bernoulli likelihood multiplied by a binomial coefficient that does not depend on \boldsymbol{\beta}. The maximiser is unchanged. The data can be stored as two columns, successes and failures, and glm recognises that layout.
Bliss (1935) exposed beetles to carbon disulphide for five hours. The dose on the page is already \log_{10} of concentration, so one unit is a tenfold increase.
| \log_{10} dose | beetles n_i | killed y_i |
|---|---|---|
| 1.6907 | 59 | 6 |
| 1.7242 | 60 | 13 |
| 1.7552 | 62 | 18 |
| 1.7842 | 56 | 28 |
| 1.8113 | 63 | 52 |
| 1.8369 | 59 | 53 |
| 1.8610 | 62 | 61 |
| 1.8839 | 60 | 60 |
dose <- c(1.6907, 1.7242, 1.7552, 1.7842, 1.8113, 1.8369, 1.8610, 1.8839)
killed <- c(6, 13, 18, 28, 52, 53, 61, 60)
notkilled <- c(53, 47, 48, 28, 11, 6, 1, 0)
response <- cbind(killed, notkilled)
summary(glm(response ~ dose, family = binomial))
The fit, in four Fisher-scoring iterations, is
            Estimate Std. Error z value Pr(>|z|)
(Intercept)  -61.249      5.206  -11.76   <2e-16
dose           34.555      2.926   11.81   <2e-16
A coefficient of 34.6 per unit of \log_{10} dose is a statement about a tenfold change in concentration, and the experiment only runs from 1.69 to 1.88.
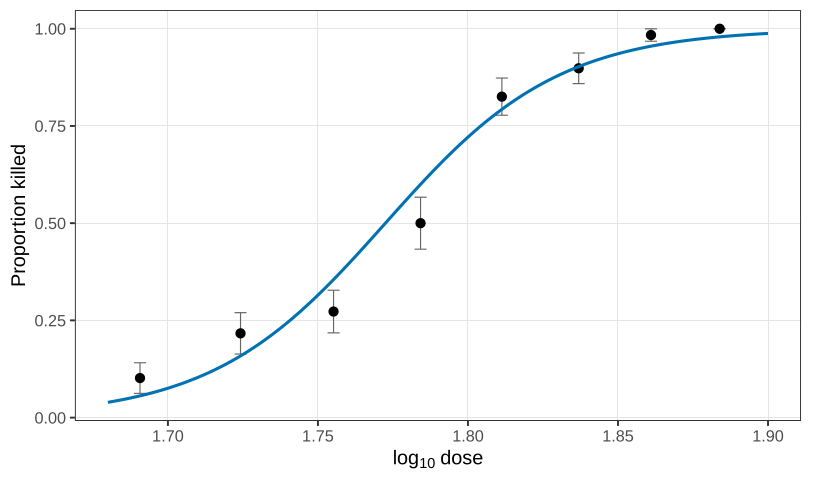
Quoting a one-unit effect is like quoting a one-kilometre effect in a study of human height. Bring the unit back to the data. For an increase of 0.01 in log-dose, \exp(0.3456)=1.41, so the odds of being killed are multiplied by about 1.41. The standard error scales the same way, 2.926\times 0.01=0.02926, and \begin{align*} \exp(0.3456-1.96\times 0.02926)&=\exp(0.288)=1.33,\\ \exp(0.3456+1.96\times 0.02926)&=\exp(0.403)=1.50. \end{align*} Rounding can put the upper endpoint at 1.49 rather than 1.50. Either rounding is the same scientific sentence: a small step up in log-dose raises the odds of death by roughly 30 to 50 percent, and the interval sits entirely above 1.
Used in
See also
Standard errors in a GLM · Count responses · Quasi-Poisson · Reading a log-linear coefficient · Mine-injury data · Count models beyond the Poisson · Overdispersion · Underdispersion