Standard error
Topic of Confidence intervals, part of Statistical inference · Also in Standard errors, and models for counts
Standard error
| Type | Topic |
| Taught in | Confidence intervals · Standard errors, and models for counts |
| Part | Statistical inference · Generalised linear models |
| Questions using it | 22 |
The standard deviation of an estimator’s sampling distribution, or an estimate of it. For a sample mean it is \sigma/\sqrt n, estimated by s/\sqrt n. An approximate 95% interval is the estimate plus or minus about two standard errors, and a z or t statistic is an estimate measured in standard errors.
In Confidence intervals
From Confidence intervals
A company introduced new safety measures. In the 50 months since, lost working hours averaged 91 per month, with bias-corrected sample standard deviation 14.1. In the 50 months before, they averaged 108, with standard deviation 14.3. The estimate of the change in mean is 91-108=-17 hours per month. How accurate is it?
Model the two runs of months as independent samples, with means \mu_1 and \mu_2 and a common variance \sigma^2. The estimator \overline X_1-\overline X_2 is unbiased for \mu_1-\mu_2, with variance
\operatorname{Var}(\overline X_1-\overline X_2)=\frac{\sigma^2}{50}+\frac{\sigma^2}{50}=\frac{\sigma^2}{25}.
Estimating \sigma^2 by the pooled variance s_p^2=(49\times14.1^2+49\times14.3^2)/98=14.20^2 gives a standard error of 14.20/5=2.84. A common way to report this is -17\pm2.84, or -17\pm2\times2.84.
What probability goes with “estimate plus or minus a standard error”? Take the simplest case, X_1,\ldots,X_n independent and \operatorname{N}(\mu,1). Then \sqrt n(\overline X-\mu) is standard normal, and
\mathbb{P}\bigl(\overline X-n^{-1/2}<\mu<\overline X+n^{-1/2}\bigr)=\mathbb{P}\bigl(-1<\sqrt n(\overline X-\mu)<1\bigr)=2\Phi(1)-1=0.683.
Plus or minus one standard error covers \mu only 68% of the time. Plus or minus two covers it with probability 2\Phi(2)-1=0.954. Choosing the multiplier is choosing the coverage.
In Standard errors, and models for counts
For a regular model and a large enough sample, the maximum likelihood estimator \hat{\boldsymbol{\beta}} is asymptotically normal, centred at the true value \boldsymbol{\beta}^\star, with covariance equal to the inverse Fisher information at that true value: \mathrm{cov}(\hat{\boldsymbol{\beta}})\approx {\color{blue}\boldsymbol{I}}(\boldsymbol{\beta}^\star)^{-1}. We never know \boldsymbol{\beta}^\star. The usable matrix plugs in \hat{\boldsymbol{\beta}}: {\color{blue}\boldsymbol{I}}(\hat{\boldsymbol{\beta}}) =\sum_{i=1}^n \frac{\bigl(\mu'({\boldsymbol{X}}_i^\top\hat{\boldsymbol{\beta}})\bigr)^2}{\widehat{\mathrm{Var}}(Y_i)}\, {\boldsymbol{X}}_i{\boldsymbol{X}}_i^\top. The standard error of \hat\beta_j is the square root of the jth diagonal entry of {\color{blue}\boldsymbol{I}}(\hat{\boldsymbol{\beta}})^{-1}. A marginal interval is \hat\beta_j\pm z_{\alpha/2}\,\widehat{\mathrm{se}}(\hat\beta_j). For a GLM we use z, not t. The normal approximation is already a large-sample statement. Once the residual degrees of freedom are past thirty or forty, a t cutoff and 1.96 are not meaningfully different, and the theory that delivers Equation (1) in Standard errors, and models for counts is a central limit theorem, not an exact normal linear model. For 95%, use 1.96.
The estimated coefficients come from Fisher scoring. Their standard errors come from the inverse Fisher information, evaluated at those coefficients. Intervals and tests for a GLM use z, not t.
Cholesterol, with standard errors
Main article: Cholesterol and heart disease
chol_file <- "data/cholest.csv"
if (!file.exists(chol_file)) {
  stop("Could not find data/cholest.csv. Set the working directory to the folder that contains it.")
}
chol <- read.csv(chol_file)
summary(glm(disease ~ gender + cholesterol, data = chol, family = binomial))
summary(glm(disease ~ cholesterol, data = chol, family = binomial))
prints
            Estimate Std. Error z value Pr(>|z|)
(Intercept) -9.3203     2.1714  -4.292  1.77e-05
gender      -0.1094     0.4873  -0.224  0.822
cholesterol  1.5842     0.3836   4.130  3.63e-05
The dispersion is reported as 1. For a binomial, that is a reminder, not an estimate: \mathrm{Var}=p(1-p) exactly, with no free \phi.
Cholesterol has a clear positive association with the log-odds of disease. Sex, given cholesterol, does not: the estimate is a tenth of its standard error. The simpler model drops sex.
            Estimate Std. Error z value Pr(>|z|)
(Intercept) -9.2012     2.0992  -4.383  1.17e-05
cholesterol  1.5549     0.3592   4.329  1.50e-05
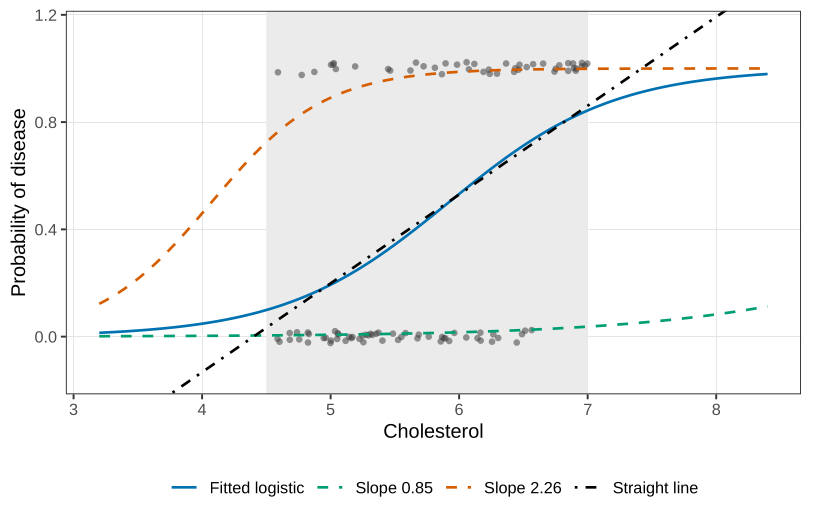
A 95% interval for the cholesterol slope is 1.5549\pm 1.96\times 0.3592=(0.85,\ 2.26). On the odds scale, a one-unit increase in cholesterol multiplies the odds of disease by something between \exp(0.85)=2.34 and \exp(2.26)=9.58. The curve on the probability scale is still an S, flat near 0 and near 1. Drawing the fitted curve at the two endpoints 0.85 and 2.26 is a pointwise band for that single slope. A simultaneous band, allowing the intercept to move as well, is a different object, and it is unnecessary for this one-slope model.
Over the short window from about 4.5 to 7, a straight line and the logistic curve are not dramatically different. That is not a reason to fit the line. A cholesterol of 4.2 or 7.2 would push a straight line outside (0,1). The logistic curve is a valid probability for every cholesterol you might hand it later. If the effect were steeper, the S would be obvious and the line would fail even inside the window. The philosophical objection stands either way.
Used in
- Taught in Confidence intervals · Standard errors, and models for counts
- Also used in Statistical inference · Hypothesis tests · Chi-squared tests · Linear regression · Estimation examples · Regression examples · Standard errors, and models for counts · Underdispersion, positive responses, and quasi-likelihood · Additive smooths · Mixtures and the EM algorithm · Estimating error rates · Logistic regression · Classification trees · High-dimensional analysis · Marginal models, and two responses at once · Three species on one hillside
- Questions that use it (22) — Summaries of ten cartons · A proportion in a poll (answer) · Lost hours after a safety programme (answer) · A critical region for a known variance (answer) · How much do the ads explain? · A difference of proportions (answer) · Height and age of pine trees · Rain, food, and orange yield · How far sharks swim · Jackknife of the mean (answer) · Q25 (answer) · Q34 (answer) · Q37 (answer) · Q41 · Q47 · Q54 · Question 3 (answer) · Question 9 (answer) · Question 19 (answer) · Question 20 (answer) · Question 21 (answer) · Question 22 (answer)
- All 6 questions on Confidence intervals
See also
Estimator · Statistic · Complete separation · Fisher information · Multicollinearity · Overdispersion · Wald test · Working correlation