Sum-to-zero and contrast constraints
Section of Two-factor analysis of variance, part of Statistical inference
Sum-to-zero and contrast constraints
| Type | Section |
| Taught in | Two-factor analysis of variance |
| Part | Statistical inference |
Eight pots carry a crossed experiment: fertiliser at two levels, water at two levels, two pots in each cell.
| Dry | Wet | |
|---|---|---|
| Low fertiliser | 4, 6 | 7, 9 |
| High fertiliser | 6, 8 | 14, 16 |
The cell means are 5, 8, 7 and 15. The grand mean is 8.75. Low fertiliser averages 6.5 and high fertiliser averages 11. Dry averages 6 and wet averages 11.5.
The sums of squares, with n=2, J=K=2, are
\begin{aligned} \mathrm{SS}_{\mathrm{fert}}&=4\bigl\{(6.5-8.75)^2+(11-8.75)^2\bigr\}=40.5,\\ \mathrm{SS}_{\mathrm{water}}&=4\bigl\{(6-8.75)^2+(11.5-8.75)^2\bigr\}=60.5,\\ \mathrm{SS}_{\mathrm{int}}&=2\bigl\{(5-6.5-6+8.75)^2+\cdots\bigr\}=12.5,\\ \mathrm{SS}_E&=(4-5)^2+(6-5)^2+\cdots+(16-15)^2=8. \end{aligned}
Each main effect has 1 degree of freedom, the interaction has 1, and the error has 4. The error mean square is 8/4=2. The F statistics are 40.5/2=20.25, 60.5/2=30.25 and 12.5/2=6.25, with upper-tail probabilities 0.011, 0.005 and 0.067. The upper 5\% point of F_{1,4} is 7.71. Both main effects are large. The interaction is the pattern in the table, an increase of 3 when water is added at low fertiliser and an increase of 8 at high fertiliser, and F=6.25 does not clear 7.71. With two pots per cell the experiment can see the pattern and cannot yet call it significant at 5\%. That is a statement about residual degrees of freedom, not a statement that the cell means are additive. The lines on the interaction plot are not parallel. The test says the non-parallelism is still compatible with additive means plus the noise in these eight pots.
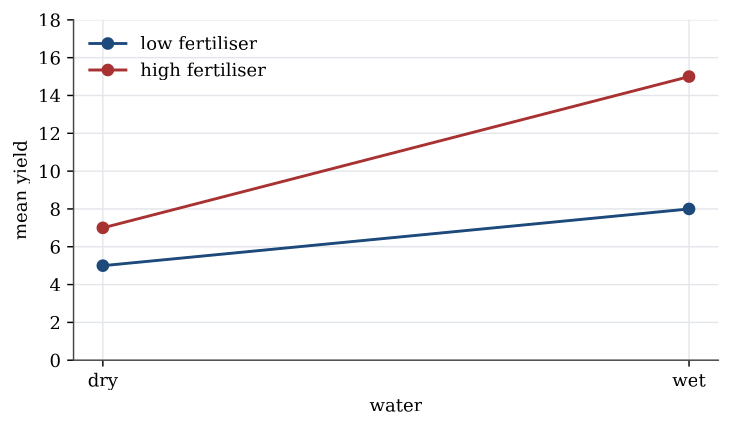
Read the same means under contrast constraints, with low fertiliser and dry water as the reference cell. The reference mean is \mu=5. Moving to high fertiliser, still in dry conditions, changes the mean by \alpha_{\mathrm{high}}=7-5=2. Moving to wet conditions, still at low fertiliser, changes the mean by \beta_{\mathrm{wet}}=8-5=3. The high-and-wet cell is 15, which is 5+2+3 plus an extra \gamma=5. The interaction coefficient is the gap between the two water effects, 8-3=5. Under sum-to-zero constraints the interaction is the same scientific fact and a different number, because each coefficient is then a deviation from an average rather than a change from the dry, low cell.
yield <- c(4, 6, 7, 9, 6, 8, 14, 16)
fert <- factor(rep(c("low", "high"), each = 4), levels = c("low", "high"))
water <- factor(rep(c("dry", "wet"), each = 2, times = 2), levels = c("dry", "wet"))
anova(lm(yield ~ fert * water))
# Coefficients are the contrast-constraint parameters, reference low/dry:
coef(lm(yield ~ fert * water))
# mu = 5, alpha_high = 2, beta_wet = 3, gamma = 5
If the interaction is dropped, the additive fit yield ~ fert + water pools \mathrm{SS}_{\mathrm{int}} into the error. The new error sum of squares is 12.5+8=20.5 on 5 degrees of freedom, and the main-effect F statistics are recomputed with that larger error mean square. Pooling is reasonable when the interaction F is small and the scientific question is an average fertiliser effect. It is not reasonable when the lines cross so sharply that the average hides the cell that actually matters. The crop example on the data-analysis page is that second situation: the interaction F is enormous, and the report is the table of cell means rather than a single fertiliser coefficient.
A significant interaction also changes what a main-effect coefficient means. Under the contrast constraints, \alpha_{\mathrm{high}}=2 is the fertiliser effect in dry conditions only. It is not the fertiliser effect averaged over water, and it is not the fertiliser effect in the wet. Quoting it as “the effect of fertiliser” drops the condition that makes the number true.
Two factors need a constraint before their coefficients mean anything. Contrast constraints measure every change from a reference cell, and the interaction is the extra change when both factors leave that cell. Sum-to-zero constraints measure deviations from averages. The F test for no interaction is the same hypothesis either way. When that test is not small, read the cell means. The main-effect coefficients are changes at the reference, or averages, and neither one is the whole experiment.