File:inf-ppv-prevalence.png
Figure file · Predictive values of a test
Size of this preview: 824 × 449 pixels. Select it to open the high-resolution file.
Summary
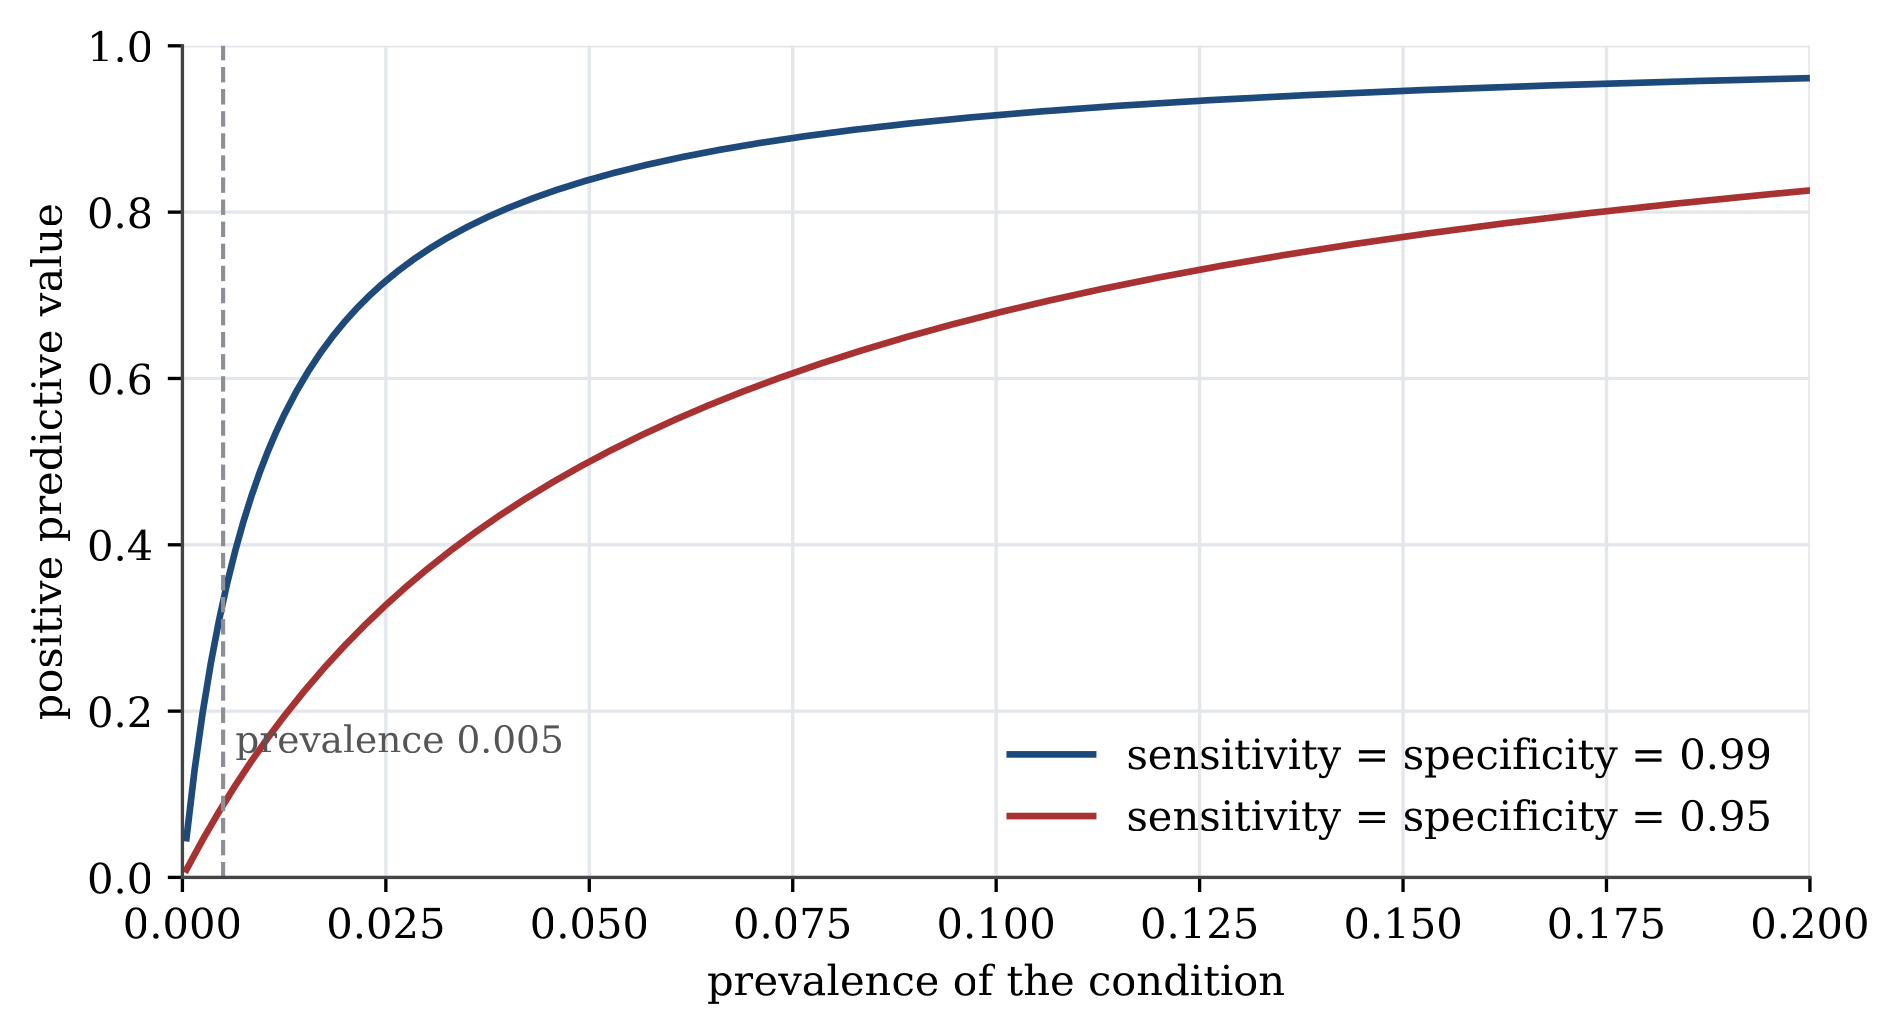
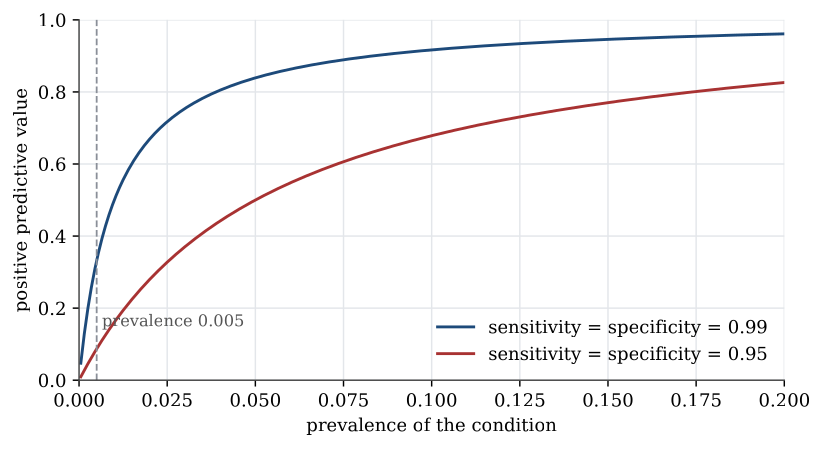
Description. Positive predictive value against prevalence for two tests. Even with sensitivity and specificity both 0.99, a prevalence of 0.005 leaves the PPV near 0.09. The curve climbs only as the condition becomes common enough for true positives to outnumber false positives.
Appears in. Predictive values of a test
Made by. Drawn with Python and matplotlib from the example data. One script draws every figure in its section.
Download
- PNG, high resolution (1900 × 1034 pixels, 119 KB)
- PNG, as shown on the wiki (824 × 449 pixels, 49 KB)
- PDF, vector, prints at any size (14 KB)
- Python script (
inference-make_figures.py)
File usage
These 2 pages show the file: