A model for the sample
Section of Studies, data, and evidence, part of Data analysis
A model for the sample
| Type | Section |
| Taught in | Studies, data, and evidence |
| Part | Data analysis |
The smallest model is a random sample: X_1,\ldots,X_n independent, with a common distribution that still contains unknown parameters. Heights of 300 men aged 40 to 50 can be modelled as independent \operatorname{N}(\mu,\sigma^2) draws. Then \mu and \sigma^2 are the population mean and variance, and the job of the analysis is to say something about them.
Two groups give two samples. Preferences for two colas, recorded as Bernoulli indicators in 100 boys and 100 girls, are independent \operatorname{Bern}(p_1) and \operatorname{Bern}(p_2) samples, or equivalently two independent binomial counts. Heights of men whose mothers did or did not smoke during pregnancy are two independent normal samples, and the comparison of interest is \mu_1-\mu_2. The intervals and tests for those comparisons are in Confidence intervals and Hypothesis tests. Worked numerical versions are in Estimation examples and Testing examples.
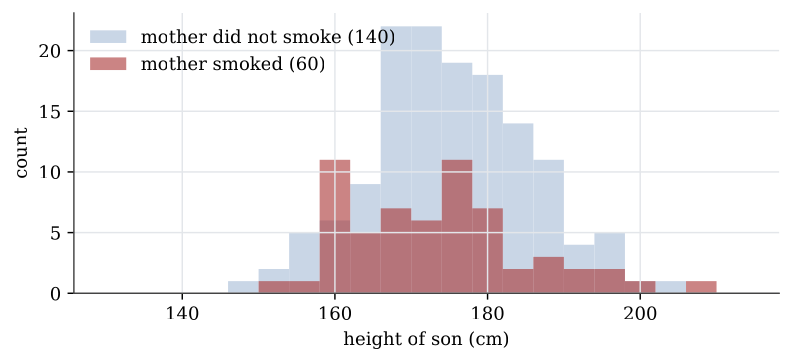
Every such model is an approximation. Heights are recorded on a discrete scale and cannot be negative, while a normal draw can be. The normal law is still useful when simulated samples look like the data and the mathematical summaries are tractable. A model that cannot reproduce the rough shape of the data is not a basis for a conclusion. Checking that shape is part of Descriptive statistics.
Used in
See also
Observational study · Designed experiment · Randomised controlled trial · Confounding variable · Blinding and placebo · Simple random sample · Stratified and cluster sampling · Observational studies and experiments