Observational studies and experiments
Section of Studies, data, and evidence, part of Data analysis
Observational studies and experiments
| Type | Section |
| Taught in | Studies, data, and evidence |
| Part | Data analysis |
Data often arrive as a spreadsheet: one row per unit, one column per variable. Units are the people, plants, households, or objects that were measured.
Definition 1 (Observational study) In an observational study the investigator does not assign the conditions being compared. A survey is the usual case. Repeating the study would produce new values in every column, because a new set of units is encountered and nothing was fixed by design.
Definition 2 (Designed experiment) In a designed experiment some columns are controlled. Treatments are assigned to units, often at random, and those assignments stay the same if the measurements are repeated. The response column changes; the treatment column does not.
The variables one hopes to explain are the response, also called the outcome. The variables used to explain it are explanatory variables, also called covariates or factors. A randomised design assigns each unit one of a small number of treatments with equal probability. After a large enough randomisation, the treatment groups agree, before treatment, on the distribution of every variable, measured or not. A difference that then appears in the response is evidence about the treatments, not about who happened to land in which group.
Measurements vary for more than one reason. Most of the variation in heights is natural diversity between people, from genetics, diet and environment. Some is measurement error. Later models try to explain part of the variation by other variables, such as sex or shoe size. What no variable in the model explains is the residual variability, and a good model leaves little of it while still predicting new data well. One or more measurements are taken on each experimental unit: a person, a plant, a plot of land, a household, a star or a manufactured object.
Definition 3 (Randomised controlled trial) In a randomised controlled trial each experimental unit receives one of several treatments, chosen at random with equal probability, and one of the treatments is a control, such as the standard treatment or a placebo. The response is then compared between the treatment groups.
Definition 4 (Confounding variable) A confounding variable affects both the explanatory variable and the response, so that an association between those two can appear, disappear or reverse when the confounder is taken into account.
Taller people tend to have shorter hair. Within each sex there may be no relationship at all: women are on average shorter than men and on average have longer hair, and sex drives both. Sex confounds the comparison of height and hair length. In a well-run randomised experiment confounding cannot arise in this way, because the treatment groups have similar distributions of every variable.
Observational studies are retrospective when they analyse data that already exist, collected for some other purpose, and prospective when they are planned and the measurements follow. Neither assigns treatments. Many attributes cannot be assigned, for physical or ethical reasons: sex, age and beliefs are examples. A comparison between groups defined by such an attribute can show association with the response, but by itself not causation.
That is why a randomised comparison can support a causal sentence and an observational comparison usually cannot. In the smoking-and-height example the mothers were not assigned to smoke. A difference in sons’ heights is compatible with an effect of smoking and also with diet, income, or anything else that differs between the two groups of mothers. Randomisation is what blocks that reading.
Blinding keeps the assignment from leaking into the response. In a blind experiment the unit does not know which treatment it received. In a double-blind experiment the person who measures the response does not know either. A placebo, an inactive treatment that otherwise resembles the active one, is what makes that possible when the act of being treated itself changes the response.
Definition 5 (Blinding and placebo) In a blind experiment the units do not know which treatment they received. In a double-blind experiment the people who give the treatments and measure the responses do not know either. A placebo is a control treatment that resembles the active one in every manageable way but lacks the active ingredient.
Blinding matters because knowledge of the treatment can change the response. Patients given an inactive sugar pill sometimes report less pain; that is the placebo effect, and only a comparison against a placebo can separate it from the effect of the drug.
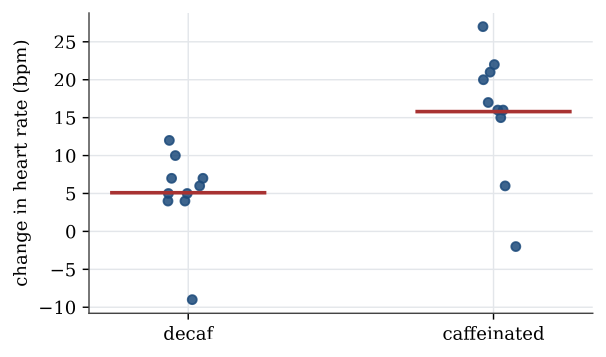
Example 1 (Alice’s caffeine experiment) Alice asks whether caffeinated cola raises the heart rate more than decaffeinated cola. She measures the heart rates of 20 friends, gives 10 of them 250 mL of caffeinated diet cola and 10 caffeine-free diet cola, waits half an hour, and measures again. The changes in beats per minute are
| Caffeinated | 17 | 22 | 21 | 16 | 6 | −2 | 27 | 15 | 16 | 20 |
| Decaf | 4 | 10 | 7 | −9 | 5 | 4 | 5 | 7 | 6 | 12 |
Question. Identify the response, the explanatory variable and the design choices, and summarise the data.
Solution. The experimental units are the 20 friends. The response is the change in heart rate, and the explanatory variable is caffeine, a factor with two levels. Several choices protect the comparison. Diet cola is compared with decaf diet cola because the two differ only in caffeine; regular and decaf regular cola also differ in sugar, energy and sodium. Half an hour is roughly the time caffeine takes to be absorbed. Choosing the 10 caffeine drinkers at random, rather than as, say, the 10 women, prevents a difference in heart rate from being a difference between the groups. Not telling the friends which drink they had, and ideally not telling whoever reads the pulse meter, prevents expectations from moving the response. Using friends at all limits the conclusion to people like Alice’s friends.
The decaf group’s mean change is 5.1 beats per minute and the caffeinated group’s is 15.8, a difference of 10.7. In a spreadsheet the data should be in standard form, one row per friend, with a column for the change and a column for the caffeine level:
alice <- data.frame(
  pb = c(17, 22, 21, 16, 6, -2, 27, 15, 16, 20, 4, 10, 7, -9, 5, 4, 5, 7, 6, 12),
  Caffeine = rep(c("Yes", "No"), each = 10)
)
tapply(alice$pb, alice$Caffeine, mean)
Whether a difference of 10.7 could easily arise by chance, with no effect of caffeine, is the question of the two-sample t test, worked in Testing examples.
A study that does not need every covariate recorded is one that randomised. Age, diet, and fitness still affect blood pressure, but if the drug and the control were assigned at random they are balanced across those variables, including the ones nobody wrote down. An observational study of the same question has to measure them, or the comparison stays confounded.
Used in
See also
Observational study · Designed experiment · Randomised controlled trial · Confounding variable · Blinding and placebo · Simple random sample · Stratified and cluster sampling · A model for the sample