Marginal and conditional effects
Section of Marginal models, and two responses at once, part of Correlated data
Marginal and conditional effects
| Type | Section |
| Taught in | Marginal models, and two responses at once |
| Part | Correlated data |
| Questions using it | 3 |
Plot risk of a birth complication against the mother’s age and the cloud rises. Label the points by mother and the story reverses.
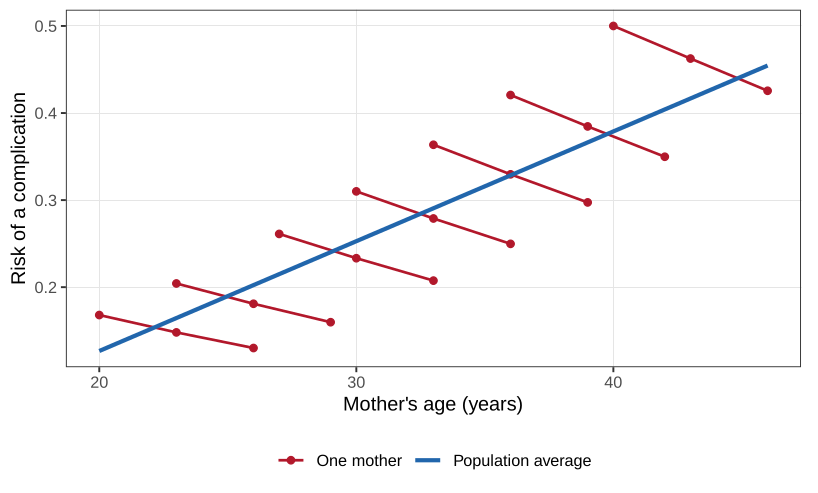
Within a mother, the second and third births are a little safer than the first, even though she is older. The red lines in Figure, one intercept and one slope per mother, are the subject-specific model of the previous chapter. The blue line through the whole cloud is the marginal, or population-average, model. They answer different questions. “What happens to this woman as she ages?” is the red line. “What does the risk look like, in this population, at a given age?” is the blue one. Which random-effects model is placed inside each mother can change the red slopes. The blue slope is the average association, and it does not have to move when the working correlation changes.
That is the attraction. We specify a mean that has an interpretation as a population average, a variance that depends on that mean, and a working association within each cluster. The working association does not have to be right. After the fit, a sandwich estimator replaces the model-based variance of \hat{\boldsymbol{\beta}} by one that uses the empirical residuals. If the mean is correctly specified, \hat{\boldsymbol{\beta}} is consistent, and so is the sandwich variance, even when the working correlation is wrong. The rate depends on how wrong it was. The guarantee is asymptotic in the number of clusters and, in the theory, in the size of each cluster. A handful of clusters, or one cluster with almost all the data, is not a setting in which the robust column should be trusted blindly.
For two binary variables the correlation cannot be chosen freely. A coin with success probability 0.2 and a coin with success probability 0.8 cannot be perfectly correlated. The largest correlation they can have is 0.25. A correlation is the wrong primitive once the margins are not normal. An odds ratio, or some other association that is free of that constraint, is the working model. And a mean plus a covariance does not determine a joint Poisson distribution. There is no unique bivariate Poisson. The marginal model does not need one.
Definition 1 A marginal model for clustered responses has three parts.
- A mean, g(\mathrm{E}(Y_{ji}\mid {\boldsymbol{X}}_{ji}))={\boldsymbol{X}}_{ji}^\top\boldsymbol{\beta}, the same link and the same linear predictor as for independent data.
- A variance, \mathrm{Var}(Y_{ji}\mid {\boldsymbol{X}}_{ji})=\phi V(\mu_{ji}), depending on the covariates only through the mean.
- A working association within a cluster, allowed to depend on the two means and on further association parameters.
The estimator solves the generalised estimating equations, the dependent version of the quasi-score. Liang and Zeger (1986) showed that the fit does not require integrating up to a likelihood. If the working variance happens to equal the truth, the sandwich collapses to the model-based inverse information, which is the best variance available. If it does not, the variance of \hat{\boldsymbol{\beta}} is the sandwich: model-based bread on the outside, the empirical residual covariance in the middle. Packages still call those pieces bread and meat.
Used in
- Taught in Marginal models, and two responses at once
- Also used in Random slopes, and a binary mixed model
- Questions that use it (3) — Question 20 (answer) · C37 · C38 (answer)
- All 6 questions on Marginal models, and two responses at once
See also
Marginal model · Warp-breaks data · Two responses, one person · Sandwich estimator · Generalised estimating equations · Working correlation