Two responses, one person
Section of Marginal models, and two responses at once, part of Correlated data
Two responses, one person
| Type | Section |
| Taught in | Marginal models, and two responses at once |
| Part | Correlated data |
A longitudinal study repeats the same measurement. A vector regression measures different things on the same unit, and each margin can have its own link and its own variance. Height and arm span, or burn area and death, are not repeated measures of one variable. Write component k on unit i as \mathrm{E}(Y_{ik}\mid {\boldsymbol{X}}_{ik})=\mu_k({\boldsymbol{X}}_{ik}^\top\boldsymbol{\beta}_k), \qquad \mathrm{Var}(Y_{ik}\mid {\boldsymbol{X}}_{ik})=\phi_k V_k(\mu_{ik}). The \boldsymbol{\beta}_k are different parameters. A working association across components can be wrong, and the sandwich corrects it afterwards.
Fan and Gibbon’s burn data, as quoted by Song, have two responses of equal interest on each patient: the log of burn area plus one, a continuous severity, and an indicator of death. Age is the covariate. The margins, fitted independently, are \widehat{\mathrm{E}}(\text{severity}\mid \text{age})=6.7118+0.0035\,\text{age}, \widehat{\mathrm{P}}(\text{death}\mid \text{age}) =\frac{\exp(-3.6891+0.0508\,\text{age})}{1+\exp(-3.6891+0.0508\,\text{age})}. The sandwich standard errors of the two slopes are 0.0017 and 0.0051. The ratios are 0.0035/0.0017=2.1, \qquad 0.0508/0.0051=10.0. Age is associated with worse burns and with a higher chance of death. The direction is not the one a purely biological story about fragile infants would have suggested. Older children are the ones who get far enough into a kitchen, or a fire, to be burned this badly. The association is marginal and confounded with exposure.
The working model here was independence: two separate glm fits, stacked. The sandwich uses the cross-products of the two residuals on the same child, so the reported standard errors are not the independence standard errors.
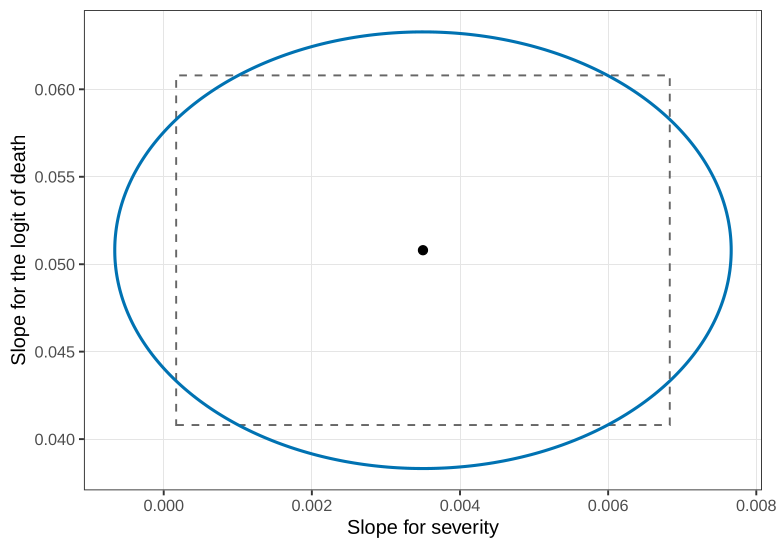
A joint confidence region for the two slopes is an ellipse, as in Figure, not the rectangle obtained by crossing the two marginal intervals. A pair that is acceptable one slope at a time can sit outside the ellipse. The ellipse puts more of its mass on “age matters for both” and less on “age matters strongly for severity and not at all for death”.
A genuine bivariate Poisson, when a distribution is wanted rather than a working covariance, is usually built by sharing a third Poisson: X_1=Y_1+Y_2, X_2=Y_2+Y_3, with Y_1,Y_2,Y_3 independent Poissons. The margins are Poisson and the correlation is positive. A minus sign can produce a negative correlation and can also produce a negative count, which is not a Poisson margin. The estimating-equation model simply declares two Poisson margins and a correlation in (-1,1), and does not claim that a joint distribution with those moments exists. That is the same descriptive licence as a quasi-likelihood.
The three plant species at a set of altitudes, where the association is an odds ratio rather than a correlation of two different kinds of measurement, are the next chapter.
From the exchangeable warp-break fit, compute \exp(3.594), \exp(-0.321) and \exp(-0.518), and state them as a baseline mean and two multiplicative comparisons with low tension.
Explain why the robust z-statistic for medium tension changes the conclusion that the naive z-statistic gave, and why the coefficients themselves did not have to move when the working correlation changed from exchangeable to AR(1).
The burn-severity slope is 0.0035 with sandwich standard error 0.0017. Compute the z-statistic and say what “marginal” means for that slope.
Why can two Bernoulli random variables with means 0.2 and 0.8 not have correlation 1?
Used in
See also
Marginal model · Marginal and conditional effects · Warp-breaks data · Sandwich estimator · Generalised estimating equations · Working correlation