Normal hierarchical shrinkage
Proposition taught in Hierarchical Bayes, part of Bayesian statistics
Normal hierarchical shrinkage
| Type | Proposition |
| Taught in | Hierarchical Bayes |
| Part | Bayesian statistics |
| Worked examples | 2 |
| Questions using it | 5 |
The final term is constant in \theta_j. The remaining kernel is normal, so \theta_j\mid\overline y_j,\mu,\tau^2,\sigma^2 \sim\operatorname{N}\!\left( \frac{B_j}{A_j},\frac1{A_j}\right). Its variance is \begin{align*} \frac1{A_j} &=\frac1{n_j/\sigma^2+1/\tau^2}\\ &=\frac{\sigma^2\tau^2}{\sigma^2+n_j\tau^2}, \end{align*} and its mean can be rearranged without omitting any terms: \begin{align*} \frac{B_j}{A_j} &=\frac{n_j\overline y_j/\sigma^2+\mu/\tau^2} {n_j/\sigma^2+1/\tau^2}\\ &=\frac{n_j\tau^2\overline y_j+\sigma^2\mu} {\sigma^2+n_j\tau^2}\\ &=\frac{n_j\tau^2}{\sigma^2+n_j\tau^2}\overline y_j +\frac{\sigma^2}{\sigma^2+n_j\tau^2}\mu\\ &=w_j\overline y_j+(1-w_j)\mu, \end{align*} where w_j=\frac{n_j\tau^2}{\sigma^2+n_j\tau^2}, \qquad 1-w_j=\frac{\sigma^2}{\sigma^2+n_j\tau^2}. Thus
\mathbb{E}(\theta_j\mid\overline y_j,\mu,\tau^2,\sigma^2) =w_j\overline y_j+(1-w_j)\mu.
Examples
Large and small tutorial classes
Worked example from Hierarchical Bayes
Suppose the overall mean is \mu=70, the within-class standard deviation is \sigma=10, and the between-class standard deviation is \tau=5. Class A has 100 students and \overline y_A=75, while Class B has only two students and \overline y_B=95.
Question. Compute the two shrinkage weights and posterior means, treating \mu, \sigma^2, and \tau^2 as fixed, and explain why the more extreme sample mean need not produce the more extreme posterior mean.
Solution. For Class A, \begin{align*} w_A&=\frac{100(25)}{100+100(25)}=\frac{25}{26}\approx0.962,\\ \mathbb{E}(\theta_A\mid\overline y_A,\mu,\tau^2,\sigma^2) &=\frac{25}{26}(75)+\frac1{26}(70)\approx74.81. \end{align*} For Class B, \begin{align*} w_B&=\frac{2(25)}{100+2(25)}=\frac13,\\ \mathbb{E}(\theta_B\mid\overline y_B,\mu,\tau^2,\sigma^2) &=\frac13(95)+\frac23(70)\approx78.33. \end{align*} The extreme average from the small class is not ignored, but it is recognised as much less precise.
Q23. Rat-tumour studies and hierarchical shrinkage
Question page: Q23. Rat-tumour studies and hierarchical shrinkage
[12 marks]
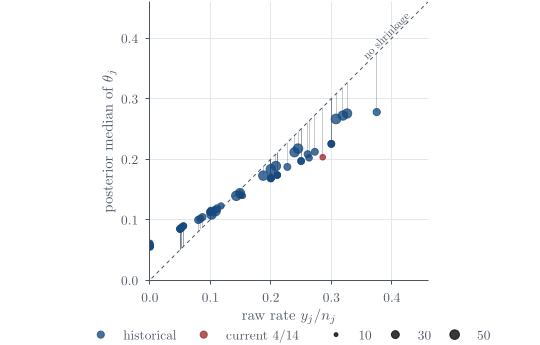
Suppose J related studies record tumour counts Y_j\mid\theta_j\sim\operatorname{Binomial}(n_j,\theta_j), \qquad j=1,\ldots,J, independently conditional on the study rates. Assume \theta_j\mid\alpha,\beta \overset{\mathrm{iid}}{\sim}\operatorname{Beta}(\alpha,\beta), \qquad \alpha\sim\operatorname{Exp}(1),\quad \beta\sim\operatorname{Exp}(1), where the two hyperpriors are independent. Write \mathbf y=(y_1,\ldots,y_J); the sample sizes n_j are known. You may use B(a,b)=\int_0^1 t^{a-1}(1-t)^{b-1}\,dt, \qquad f(\theta\mid a,b)=\frac{\theta^{a-1}(1-\theta)^{b-1}}{B(a,b)}.
(a) [2 marks] Derive and identify the full conditional distribution \theta_j\mid\alpha,\beta,\mathbf y.
(b) [3 marks] For this part only, fix \alpha=2 and \beta=8. Two studies report (y_1,n_1)=(4,10),\qquad (y_2,n_2)=(40,100). Calculate both posterior means. Although both observed proportions equal 0.4, explain why the posterior means differ and identify which study experiences stronger shrinkage.
(c) [4 marks] Return to unknown \alpha,\beta. Integrate out the study rates to derive:
(i) the marginal probability \mathbb{P}(Y_j=y_j\mid\alpha,\beta);
(ii) the marginal posterior kernel p(\alpha,\beta\mid\mathbf y).
Express your answers using Beta functions. Explain why the Beta prior’s normalising factor cannot be discarded when deriving this hyperparameter posterior.
(d) [3 marks] Explain how the full Bayesian model allows studies to share information. What uncertainty is omitted if \alpha,\beta are instead estimated from the data and then treated as known?
Definitions. Study j has observed count y_j, known size n_j, and unknown rate \theta_j; \alpha,\beta>0 are shared hyperparameters. A \operatorname{Beta}(\alpha,\beta) density is \theta^{\alpha-1}(1-\theta)^{\beta-1}/B(\alpha,\beta) on (0,1), where B(a,b)=\int_0^1u^{a-1}(1-u)^{b-1}\,du. \operatorname{Exp}(1) uses rate one. Partial pooling allows different study rates linked through a common population distribution.
Assumptions. The hierarchy assumes conditional independence of studies given their rates, and iid Beta rates given \alpha,\beta. Thus its joint density factors as p(\alpha)p(\beta)\prod_jp(\theta_j\mid\alpha,\beta)p(y_j\mid\theta_j), with independent rate-one exponential hyperpriors. Only in part (b) are the hyperparameters fixed at the supplied values.
(a) Full conditional for a study rate. Holding \alpha,\beta fixed, the factors involving \theta_j are \begin{aligned} p(\theta_j\mid\alpha,\beta,\mathbf y) &\propto p(y_j\mid\theta_j)p(\theta_j\mid\alpha,\beta)\\ &\propto\theta_j^{y_j}(1-\theta_j)^{n_j-y_j} \theta_j^{\alpha-1}(1-\theta_j)^{\beta-1}\\ &=\theta_j^{\alpha+y_j-1}(1-\theta_j)^{\beta+n_j-y_j-1}. \end{aligned} Therefore \boxed{\theta_j\mid\alpha,\beta,\mathbf y \sim\operatorname{Beta}(\alpha+y_j,\beta+n_j-y_j),\qquad 0<\theta_j<1.} Conditional on the hyperparameters and data, the study rates are independent. Other studies’ observations affect this study’s marginal posterior through learning \alpha,\beta, not through an additional factor in this full conditional.
(b) Posterior means and shrinkage. For fixed \alpha=2, \beta=8, the population mean is \frac{\alpha}{\alpha+\beta}=\frac2{10}=0.2. The two posteriors are \theta_1\mid\alpha=2,\beta=8,\mathbf y\sim\operatorname{Beta}(6,14), \theta_2\mid\alpha=2,\beta=8,\mathbf y\sim\operatorname{Beta}(42,68). Thus their posterior means are \boxed{\mathbb{E}(\theta_1\mid\alpha=2,\beta=8,\mathbf y)=\frac6{20}=0.3,} \boxed{\mathbb{E}(\theta_2\mid\alpha=2,\beta=8,\mathbf y)=\frac{42}{110} \approx0.3818.} To see the shrinkage explicitly, write \frac{\alpha+y_j}{\alpha+\beta+n_j} =\frac{\alpha+\beta}{\alpha+\beta+n_j} \frac{\alpha}{\alpha+\beta} +\frac{n_j}{\alpha+\beta+n_j}\frac{y_j}{n_j}. Both sample proportions equal 0.4, but study 1 puts weight 10/20=1/2 on the population mean, whereas study 2 puts only 10/110=1/11 on it. The smaller study therefore experiences stronger shrinkage toward 0.2. The larger study has more information about its own rate, so its posterior mean remains closer to its observed proportion.
(c) Integrating out the study rates. For one study, retain the normalising factor of the Beta density: \begin{aligned} \mathbb{P}(Y_j=y_j\mid\alpha,\beta) &=\int_0^1 p(y_j\mid\theta_j)p(\theta_j\mid\alpha,\beta)\,d\theta_j\\ &=\binom{n_j}{y_j}\frac1{B(\alpha,\beta)} \int_0^1\theta_j^{y_j+\alpha-1} (1-\theta_j)^{n_j-y_j+\beta-1}\,d\theta_j\\ &=\boxed{\binom{n_j}{y_j} \frac{B(\alpha+y_j,\beta+n_j-y_j)}{B(\alpha,\beta)}.} \end{aligned} This is a Beta–Binomial marginal distribution, with y_j\in\{0,\ldots,n_j\}.
The independent rate-one exponential hyperpriors give p(\alpha,\beta)=e^{-\alpha-\beta},\qquad \alpha>0,\quad\beta>0. The studies remain independent conditional on the hyperparameters after their individual rates have been integrated out. Consequently, \begin{aligned} p(\alpha,\beta\mid\mathbf y) &\propto p(\alpha,\beta) \prod_{j=1}^{J}\mathbb{P}(Y_j=y_j\mid\alpha,\beta)\\ &\propto e^{-(\alpha+\beta)} \prod_{j=1}^{J} \frac{B(\alpha+y_j,\beta+n_j-y_j)}{B(\alpha,\beta)}. \end{aligned} Hence \boxed{ p(\alpha,\beta\mid\mathbf y) \propto e^{-(\alpha+\beta)}B(\alpha,\beta)^{-J} \prod_{j=1}^{J}B(\alpha+y_j,\beta+n_j-y_j), \quad \alpha,\beta>0. } The binomial coefficients can be dropped because the observed y_j and known n_j make them constant with respect to \alpha,\beta. However, 1/B(\alpha,\beta) depends on the hyperparameters, so it must remain. A factor constant in \theta_j need not be constant in \alpha,\beta.
(d) Sharing information and hyperparameter uncertainty. Every study contributes to the posterior for the common population parameters \alpha,\beta. That posterior then contributes to each study-specific posterior through p(\theta_j\mid\mathbf y) =\int_0^\infty\!\int_0^\infty p(\theta_j\mid\alpha,\beta,\mathbf y) p(\alpha,\beta\mid\mathbf y)\,d\alpha\,d\beta. This is partial pooling: study rates can differ, but they are connected by a population distribution learned from all the studies. The model does not force them to be identical, and it does not treat them as unrelated.
Replacing \alpha,\beta by fixed estimates is an empirical-Bayes plug-in analysis. It omits uncertainty about the population distribution’s parameters. For example, the law of total variance gives \begin{aligned} \operatorname{Var}(\theta_j\mid\mathbf y) ={}&\mathbb{E}\!\left[ \operatorname{Var}(\theta_j\mid\alpha,\beta,\mathbf y) \mid\mathbf y\right]\\ &+\operatorname{Var}\!\left[ \mathbb{E}(\theta_j\mid\alpha,\beta,\mathbf y) \mid\mathbf y\right]. \end{aligned} The second term represents variation in the conditional mean as the hyperparameters vary under their posterior. A plug-in calculation does not propagate this variation and can therefore give an overly precise account of uncertainty.
Key result. Conditional conjugacy does not eliminate uncertainty in the hyperparameters. Full Bayes learns their distribution and averages over it.
Used in
- Taught in Hierarchical Bayes, where the derivation and examples are.
- Questions that use it (5) — A shrunken sample mean (answer) · Q2 (answer) · Q23 · Q53 (answer) · Question 17 (answer)
- All 9 questions on Hierarchical Bayes
See also
Hierarchical Bayesian model · Hyperparameter · Exchangeability · Empirical Bayes · Study-rate full conditional · Marginal hyperposterior · Uniformity depends on a domain · Grid Monte Carlo approximation