Traffic data
Section of Forecasting, part of Time series
Traffic data
| Type | Section |
| Taught in | Forecasting |
| Part | Time series |
WWWusage counts hits on a server, one number per minute for 100 minutes. There is no season in a series that short.
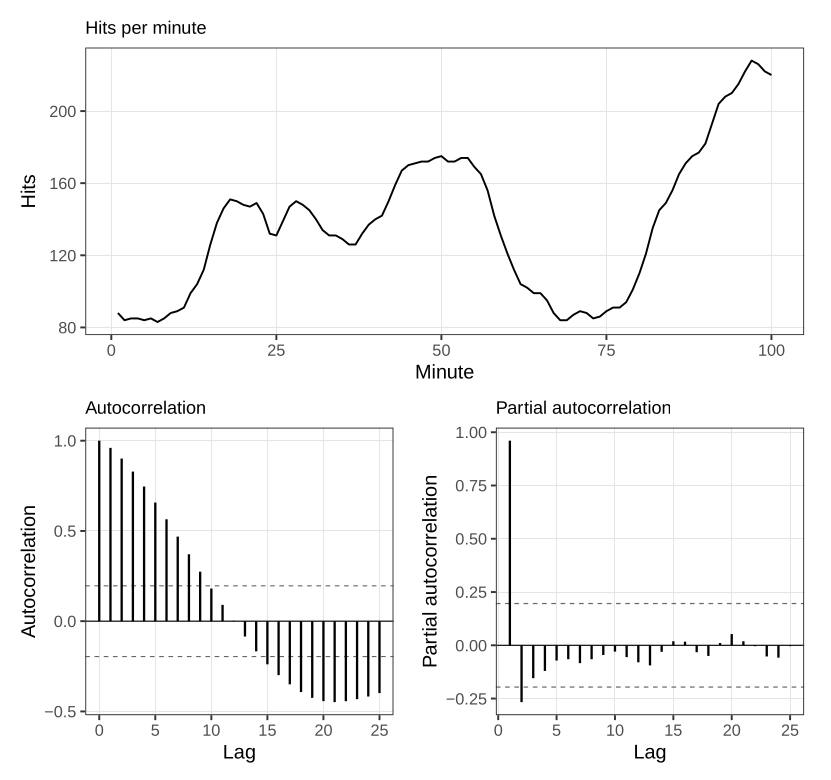
The autocorrelation in Figure dies slowly. The partial autocorrelation dies after a lag or two. After one ordinary difference the series is closer to a flat mean, and auto.arima selects an ARMA(1,1) on that difference:
need <- function(pkg) {
  if (!requireNamespace(pkg, quietly = TRUE)) {
    install.packages(pkg, repos = "https://cloud.r-project.org")
  }
  suppressPackageStartupMessages(library(pkg, character.only = TRUE))
}
need("forecast")
auto.arima(WWWusage, seasonal = TRUE)
The fit has no seasonal piece: one difference, one autoregressive coefficient, and one moving-average coefficient. Both coefficients are positive. A busy minute is followed by a busy minute, and a minute that was busy relative to the minute before it is followed by a minute that is busier still. That is a trend, of the sort a topic has when it is spreading, and it does not need a separate time covariate.
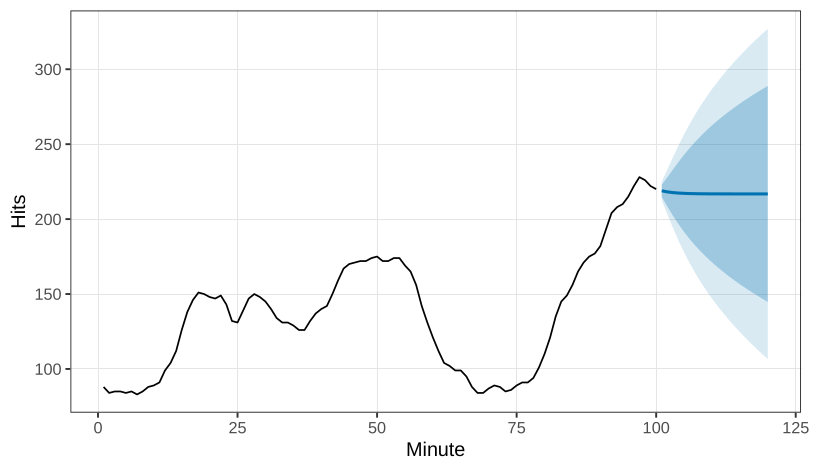
The forecast of the next minutes, in Figure, is a shallow line, and the interval widens as the horizon moves away. At a long horizon the forecast has forgotten the local level and sits on the mean that the difference implies.
Used in
- Taught in Forecasting
- All 2 questions on Forecasting
See also
Accidental-deaths data · Partial autocorrelation · ARIMA model · Unit root · Seasonality · Trend · Cycle · Point forecast